High performance end mill design and grinding analysis mode
2020-05-04
I. Abstract
Along with the development of semi-conductor and micro-system technology, many 3C/IA products will develop into high capacity and high functional direction. The requirements of parts will therefore move toward ultra-precision and miniaturization. Accordingly, the development and demand of precise-mold/die will be the main stream in the future. Due to the fast development in cutting technology these years, the different types of precise cutting tools raise a lot in the market. Since the design and grinding of end-mill is the last and the most important processing in tool producing, the geometry accuracy of end-mill and the performance of cutting depend mainly on the grinding method. Yet, the complicated geometry of end-mill will be ground by the precise software of CAD/CAM on the 5-axis CNC tool grinding machine. First, the project was focused on constructing the analysis model of optimal cutting performance in end-mill for high-speed machining. The geometric angle of end-mill could be designed & ground by the FEM software and the CAD/CAM of tool-grinding in the 5-axis tool grinding machine. So the optimal geometry of end-mill would be ground by the different grinding-parameters. Then using the Taguchi-method to construct the high-speed milling experiment for the SKD61 mold steel cutting with the end-mill of different grinding –parameters in high revolution CNC center. Tool wear and life can be well known by the experiment result. The analysis model of end-mill grinding parameter for tool life of high-speed milling could be constructed using a polynomial network. The geometric type of cutting edge be designed & ground by the FEM software and the CAD/CAM of tool-grinding in the 5-axis tool grinding machine. Then the high-speed milling experiment of the SKD61 mold steel would be done by using the optimal end-mill (geometric angle, cutting edge and grinding-parameters) in high revolution CNC center. The analysis model of optimal cutting performance in end-mill for high-speed machining could be constructed.
II. Content of the report
1. Preface
In recent years, there has been a rapid development of cutting technology in the fields of high-speed milling and microfine shape cutting. With the development and application of new engineering materials and the miniaturization and precision of components, tool manufacturers are actively developing high efficiency tools for various machining applications, and the growing demand for tool products has led tool manufacturers to expand their production capacity at home and abroad. As global cost competition continues to increase, users are increasingly demanding high value-added, efficient production of tools. In terms of tool users, tool manufacturing is also one of the industries with the largest tool usage. Tooling is used in almost all aspects of the mold making process, such as molding, hot work, cold work, and plastic molding. In addition, the automotive, high-speed rail, general machinery manufacturing, and woodworking industries, which have been increasing their use in recent years, have all become major users in the tool industry, and aviation is the most traditional and important tool application area. In addition, advanced cutting technologies such as high speed hard milling and compound cutting are the production methods to achieve increased production efficiency, speed and flexible machining of parts with minimal production equipment. However, no cutting method can be separated from the selection of the right cutting tool and the exact parameters of its use.
Dry machining technology is one of the major directions for the future development of green machining technology. Dry machining is not using cutting fluids, the cutting conditions are more severe and the tool life is reduced. Therefore, the selection and design of the tool geometry plays a crucial role in dry cutting, in addition to the selection of a reasonable tool material and tool grinding parameters and the appropriate coating. On the other hand, there is a certain gap between the domestic and foreign technology in the tool design base, so the only way to build the milling chip forming simulation analysis through FEM as the basis for tool development and design, and then through a complete and detailed construction of the most suitable cutting performance of high-speed machining end mill design and grinding mode, from the above development mode will be the best tool design mode to save development time and money, and will also be a key technology to improve the standard of precision tool design and manufacturing, so tool design and grinding technology is very urgent and worth investing in the machining.
2. Purpose of the study
The main factors affecting the high speed cutting performance of end mills are tool geometry, tool grinding accuracy and tool edge shape. First of all, FEM high-speed cutting simulation analysis is used to analyze the effects of rake angle and relief angle on high-speed cutting performance (cutting force, chip shape, highest temperature of tool, ...), combined with Taguchi's experimental design method and variance analysis, a series of end mills with different geometries are planned. In addition to grinding accuracy, tool geometry and cutting conditions, the cutting edge shape (sharp or chamfered) should have a significant impact on the quality and cutting performance of end mills for high-speed machining. A five axis CNC tool grinder is used to grind out end mills with different cutting edge shapes and to conduct high-speed milling experiments with a high-speed cutting machine. In this analysis process, the optimal design of tool grinding accuracy, geometry and cutting conditions, together with the systematic analysis and integration of the cutting edge shape, should be able to build a set of end mills for high-speed machining design and grinding analysis mode to optimize the cutting performance.
3. Literature research
The research on tool grinding and surface roughness at home and abroad is as follows: Chen established a method for grinding cone-end end mills using 2-axis CNC tool grinder, Lai developed a precise design and grinding method for tapered ball end mills, Agarwal used probability and statistical methods to predict the surface roughness of ceramic grinding, Kwak applied Taguchi method and reaction surface method to investigate the error of surface grinding process, Shaji analyzed grinding parameters that affect the surface quality, such as grinding wheel, workpiece, processing and mechanical parameters, etc. Kim conducted experimental analysis of cylindrical grinding process using Taguchi method to obtain the relative influence variables and maximum percentage of surface roughness improvement. Alauddin used the reactive surface method to predict the milling process and the second-order prediction model to obtain the best cutting conditions for tool life. Suresh used the reactive surface method and genetic algorithms to predict surface roughness and optimize process parameters.Hecker used the arithmetic mean of surface roughness to predict the grinding thickness model. Tool grinding related industry is quite conservative and closed, more detailed and practical tool grinding technology literature is the company's Know-How, not easy to obtain, the entire tool grinding technology are in the foreign manufacturers, such as WALTER, ROLLOMATIC, ANCA, JUNGER, ............ Guo from the discontinuous chip forming FEM simulation analysis, it can be found that the chip breaking occurs in the position above the cutting edge. Qian Simulated CBN tool high-speed turning AISI 52100 bearing steel, AISI H13 hot work tool steel, AISI D2 cold work tool steel and AISI 4340 low alloy steel, mainly focusing on the influence of cutting angle and cutting conditions on the cutting force, Ceretti Applied Arbitrary Lagrangian Eulerian Finite Element Method to simulate and analyze the construction of heat transfer coefficient model between tool and chip under orthogonal cutting. Shi applied ABAQUS software to investigate the effects of heat generated by friction along the tool-chip interface of metal orthogonal cutting. Ceretti used DEFORM-2D bodies to simulate the trend relationship between cutting conditions and chip formation during orthogonal cutting. With the advancement of technology, the technology of high speed machining has grown more and more complete in recent years with the continuous advancement of high-speed machining machines and peripheral technology. Schulz published a number of papers in the 1990s defining the true meaning of high speed cutting and explaining that high speed cutting not only increases productivity, but also reduces cutting force, thermal deformation of the workpiece and clamping system, good surface roughness, and more stability during cutting. Cai Zhi-Cheng, a Chinese scholar, has also done some research on the optimal cutting parameters for high speed milling of mold alloys. Some other scholars have done some research on the cutting performance of high speed cutting applied to different materials and some analysis on the development of high speed cutting.
4. Research methodology
This research method firstly applies DEFORM 2D software to build a process analysis model for milling SKD61 die steel, which can understand the process of chip formation and predict the tool performance. Milling simulation experiments are planned using a straight table. The process parameters include four parameters: effective rake angle, clearance angle, cutting speed and depth of cut. Evaluating the performance of the milling process has five main quality characteristics: metal removal rate, tool temperature, chip temperature, cutting force, and maximum tool temperature and tip distance, which are multiple quality characteristics. Applied gray correlation analysis converts multiple quality characteristics into a single performance metric, the gray correlation degree. Then use Taguchi parameter design to find the best solution to satisfy multiple quality characteristics process parameters. Finally, a tool grinding software with a 5-axis tool grinder was used to grind the round-nose milling tool required for the experiment, and the SKD61 die steel was tested for milling to verify the accuracy of the simulation results. The management of the quality of precision milling is greatly enhanced by the understanding of the life of the cutter in milling. In this study, the influence of tool geometry and cutting conditions on the high speed cutting of SKD61 die steel will be further analyzed to determine the influence of tool grinding quality. This predictive model can be provided to tool grinding operators as a basis for improving tool grinding accuracy. Finally, the first stage of optimizing the tool geometry and cutting conditions is used as the basis for the design of the tool edge shape. The DEFORM 2D software is used to build an analytical model of the different tool edge shapes, which can be used to understand the process of chip formation by the tool edge chamfer angle. With the same cutting speed, depth of cut, and effective cutting angle in combination with clearance angle, change the chamfering angle of the cutting edge to simulate the experiment. The results were evaluated in terms of cutting force, tool temperature and chip temperature, and finally the end milling tools for the experiment were ground using the tool grinding software with a 5-axis tool grinder. From the above three-stage experimental method, a high-performance end mill tool design and grinding analysis model will be constructed.
5. Results and discussion
5.1 Constructing an optimal model for milling
This year's cutting model is based on the Micro-Milling Optimization Design Model (MODM) constructed in the 1997 NSC program, using DEFORM- 2D software to construct the MODM. After the simulation, five quality characteristics, such as metal removal rate, tool temperature, chip temperature, cutting force, and the highest temperature distance between the tip and the tool, are the performance indicators to judge the tool life. In order to reduce the number of simulations, this paper applies a straightforward table to the configuration and analysis of the experiment, and still obtains very similar results to the full-factor experiment. The process parameters that affect the cutting performance are cutting angle (A), clearance angle (B), cutting speed (C), and depth of cut (D), etc. Therefore, this plan sets the four parameters as controllable factors, and each controllable factor sets three levels. The choice of the straight table is related to the total freedom of the factor. In this study, the four controllable factor levels are all 3, and the total factor freedom is 8. The interactions between the factors are not considered in the experiment, so the L9(34) direct intersection table is used. The layout of the experiment is shown in Table 1. Metal removal rate, tool temperature, chip temperature, cutting force, and the maximum temperature distance between the tip and the tool are closely related to the tool life, so this study selected these four quality characteristics as important indicators to evaluate cutting performance.
5.1.1 Model construction
After the experimental planning is completed, DEFORM-2D software is applied to construct the milling model according to the experimental layout parameters in Table 1, as shown in Figure 1. The number of simulation steps is defined 1 step as 0.0001mm for a total of 2000 steps. Table 1 Taniguchi method L9 Experimental planning table.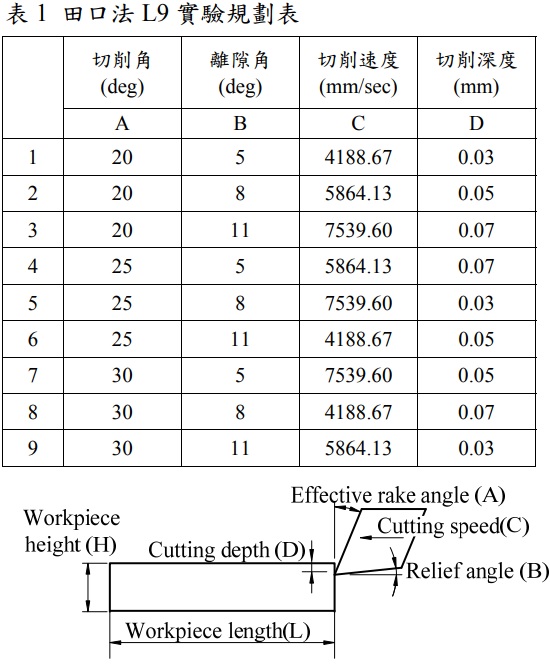
5.1.2 Simulation results
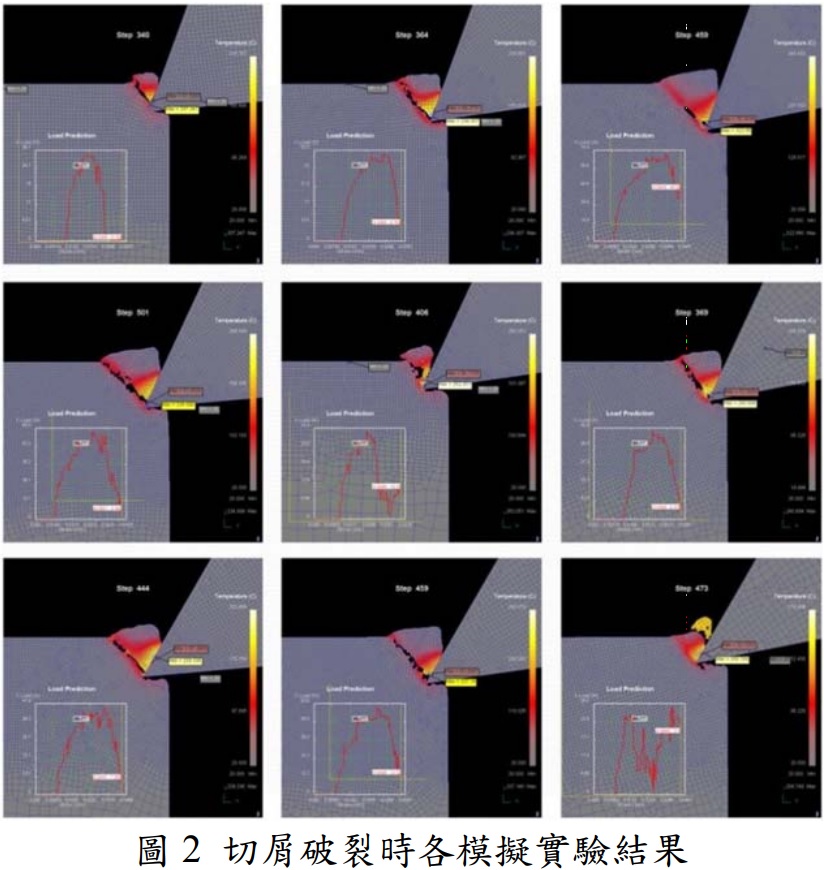
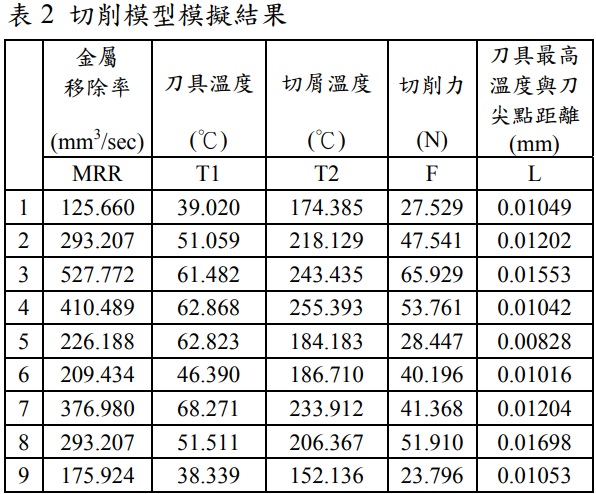
Figure 2 shows the simulation results of nine sets of experiments. The experimental data were extracted as the average of the four quality characteristics of the tool temperature, chip temperature, cutting force, and the distance between the tip and the highest temperature of the tool at the time of maximum cutting force (Step).In addition, the metal removal rate is calculated using a fixed axial depth of cut of 1.0mm in combination with the cutting speed and depth of cut, and the overall simulation results are shown in Table 2.
5.1.3 Simulated data analysis and discussion
After the results of milling simulation, five quality characteristics are obtained, namely, metal removal rate, tool temperature, chip temperature, cutting force, and the maximum temperature distance between the tip and the tool, the process parameters are analyzed by the gray correlation Taguchi method, to find the best and worst combination of parameters, the steps to optimize the parameter design are as follows.(1) Calculate the SN ratio from the experimental results
(2) Regularize the SN ratio
(3) Calculating the ash correlation coefficient
(4) Calculation of grey correlation
(5) Calculation of the Factor Response of Gray Correlation
(6) Analysis of variance for calculating the ash correlation (ANOVA)
(7) Select the best and worst level of cutting parameters
5.1.3.1 Experimental data calculation
In this study, the simulated cutting performance is evaluated by the tool life and metal removal rate, when the metal removal rate is greater, it means the tool can remove more metal material, so it is the expectancy characteristic, while the tool life is evaluated by the tool temperature, chip temperature, cutting force, tool maximum temperature and tip distance. First, the simulation results of Table 2 were brought into the Taniguchi formula of large and small expectation to calculate each SN ratio, and then the SN ratio of each item was normalized so that its value is between 0 and 1. After normalizing the quality characteristic data, it must be converted into gray correlation coefficient again. Finally, as can be seen from Table 3, the simulated results of the process parameter set of Group 9 have the largest gray correlation value (0.765), i.e., the Group 9 experiment has the best multiple quality characteristics among the simulated experiments of Group 9.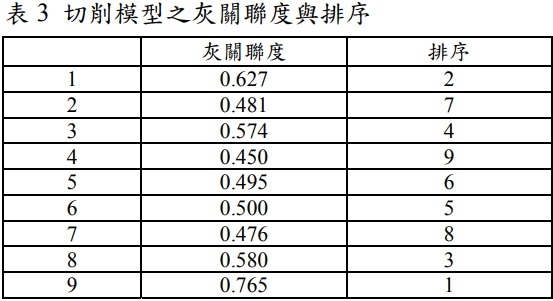
Next, from the overall gray correlation values in Table 4, calculate the average gray correlation of the overall effect of each cutting parameter at each horizontal value on multiple quality characteristics, i.e., make a response table, the results are shown in Table 4. The higher the mean gray correlation value, the better the multiple quality characteristics. The purpose of variance analysis is to statistically understand the extent to which cutting parameters affect multiple quality characteristics. The analysis of the number of variance using the grey correlation response table is shown in Table 5. From the analysis of the number of variance, it can be seen that the parameter depth of cut (D) has the greatest influence on multiple quality characteristics, followed by the cutting angle (A), clearance angle (B) and cutting speed (C). The best level combination of the cutting parameters is A3B3C1D1 and the worst level combination is A2B1C3D2, and the collation is shown in Table 6.
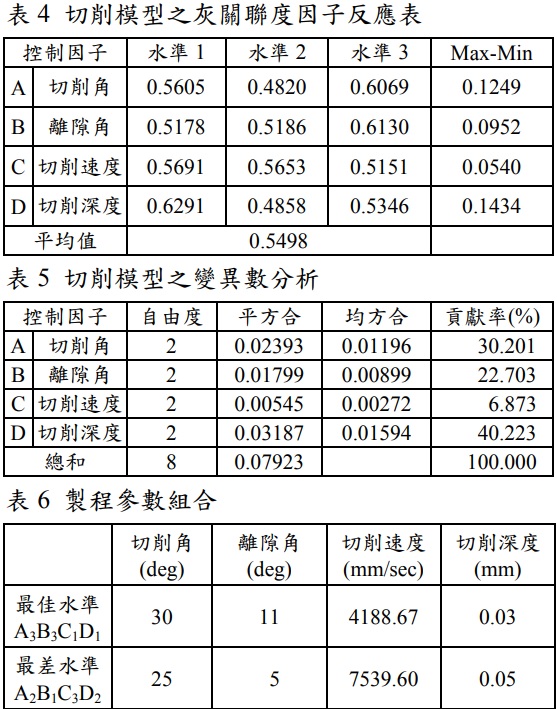
5.1.3.2 Validation of simulation results
The basic angles of end mill grinding are radial cutting angle, radial clearance angle, spiral angle, axial cutting angle, axial clearance angle and end face concave angle. In this study, the helix angle is set to 35 degrees, the axial cutting angle is 1/3 of the cutting angle, and the radial-axial clearance angle is the same as the simulation result. The fixed tool geometry parameters of the end mill tool for the verification experiment are tool diameter: 8mm; helix angle: 35 degrees; end flute concave angle: 1.5 degrees; round nose R angle: 0.5 R. The angles of the round nose end mill tool for the verification experiment are listed in Table 7. Use the TG-5 PLUS tool grinder to grind the desired end mill tool according to the geometry of the end mill tool to be ground in Table 7. In this study, we will use actual cutting to verify the feasibility of the cutting pattern and the optimized design pattern created by DEFORM- 2D software. The verification experiment was carried out using a high-speed integrated processing machine, type B8. In the validation experiment, a fixed axial depth of cut (AD) of 1.0 mm and a radial depth of cut (RD) of 1.0 mm were performed using reverse milling. The experimental results are presented in Table 8.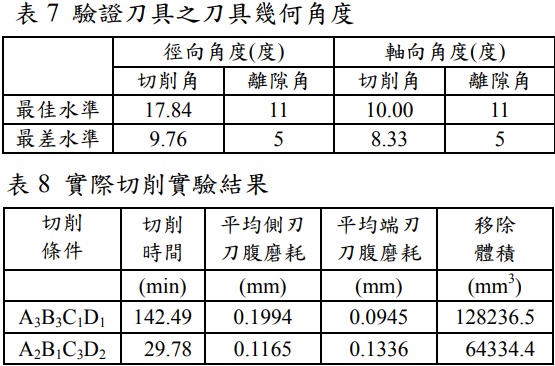
The tool life in Table 8 is the total cutting time when the tool belly is broken during cutting (at this time the tool belly wear is less than 0.2mm). As can be seen from Table 8, the best cutting condition does have better cutting performance than the worst condition, with a difference of 112.71(min) in cutting time and 63902.1(mm3) in removal volume. Fig. 3 and Fig. 4 show the relationship between cutting time and end-edge and peripheral-edge tool belly wear under the best and worst cutting conditions.
.jpg)
Fig. 4 Relationship between cutting time and end-edge tool belly wear from Figs. 3 and 4, it can be seen that tool wear, both in peripheral and end-edge wear, is intense at the beginning and then gradually subsides. The analysis of the above results illustrates the feasibility of the process parameter optimization algorithm for multiple quality characteristics proposed in this study.
5.2 Construction of a tool grinding surface roughness prediction system
In general, the better the surface roughness of the tool, the better the surface roughness value can be obtained. In order to increase the accuracy of the experimental and actual grinding process, a 33-factor experimental plan was adopted for the grooving (radial like cutting surface) and radial clearance respectively. The grinding conditions that affect the surface roughness are grinding wheel size, grinding speed and feed speed. In this experiment, the process parameters are considered as controllable factors and each control factor is set to three levels, the levels of the process parameters chosen for this experiment are shown in Tables 9 and 10.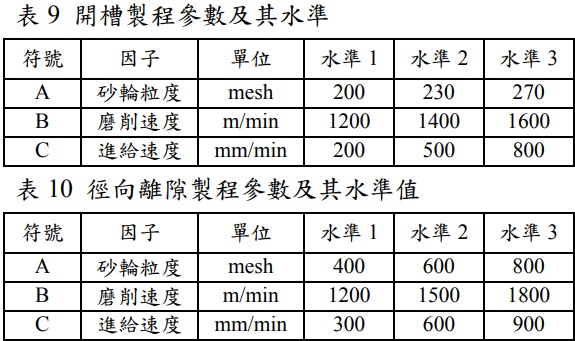
5.2.1 Measurement and analysis of surface roughness
After the experiment, the Surfcorder SEF-3500 non-contact surface roughness gauge was used to measure the surface roughness change of each tool. The surface roughness measurement of the groove (radial cutting surface) is set as V.mag=2000, H.mag=100, Cutoff=0.08, E.length= Cutoffx5 and Speed=0.1m/s. The surface roughness measurement of the radial clearance surface is set as V.mag=2000, H.mag=100, Cutoff=0.25, E.length= Cutoffx5 and Speed=0.1m/s. The measurement results are shown in Figure 5 and Figure 6. The results of surface roughness measurements based on the radial cutting surface and radial clearance surface of the tool are summarized as follows.
(1). From Figure 5(a)-(c)
At a grinding speed of 1200m/min, the Ra corresponds to different feed speeds, but at 1400 and 1600m/min, the Ra of 500 and 800mm/min shows almost overlap, but it can be ascertained that the Ra is better due to the fine grain size of the grinding wheel. From Fig. 5(d)-(f), the relationship between grinding speed and Ra results in the same way as above.
(2). From Figure 5(g)-(i)
At grinding speeds of 1200 and 1400m/min, the amount of change in Ra is not significant due to the grinding effect of different wheel sizes, but at the same grinding speed, a better Ra is obtained at a lower feed rate of 200mm/min.
(3). From Figure 5(h) it is known that
At a grinding speed of 1600m/min, the change in Ra of the grinding speed 200 to 800mm/min and the change in grain size 230 and 270mesh is not significant, and the change in Ra of the grain size 200mesh is significant, but at a feed speed 200mm/min, the change in Ra of the grinding wheel grain 200 to 270mesh is not significant when grinding the tool.
(4). From Figure 6(a)-(c)
The Ra is almost overlapping for different feed speeds at 400mesh, and the correlation between feed and Ra is not significant at 1200 and 1500m/min, but is worse at 600mesh and 300mm/min, and is less different at 1800m/min for 300 and 900mm/min, but is better at 600mm/min for the same size, and is better at 800mseh for 300mm/min.
(5). From Figure 6(d)-(f)
There is no significant change in Ra between 1500 and 1800m/min at different diamond sizes. The slower the grinding speed, the worse the Ra performance. The finer the particle size, the better the Ra. At particle sizes above 400mesh, the surface roughness of the feed is poorer at 300mm/min, and the effect of 600 and 900mm/min feeds is not significant.
(6). From Figure 6(g)-(i)
The higher the feed speed, the Ra at 400mesh does not change significantly, but the faster the grinding speed, the better the Ra performance, but the worse the Ra at 600mesh feed speed 300mm/min, the better the Ra at 600mm/min, and the worse the Ra at 1500 and 1800m/min with increasing feed speed between 600mesh and 800mesh..jpg)
(a) Grinding speed 1200m/min (b) Grinding speed 1400m/min (c) Grinding speed 1600m/min (d) Grinding wheel size 200mesh (e) Grinding wheel size 230mesh (f) Grinding wheel size 270mesh (g) Grinding speed 1200m/min (h) Grinding speed 1400m/min (i) Grinding speed 1600m/min
(a) Grinding speed 1200m/min (b) Grinding speed 1500m/min (c) Grinding speed 1800m/min
(d) Grinding wheel size 400mesh (e) Grinding wheel size 600mesh (f) Grinding wheel size 800mesh (g) Grinding speed 1200m/min (h) Grinding speed 1500m/min (i) Grinding speed 1800m/min
5.2.2 Construction of a surface roughness prediction system
After the diamond grinding wheel grinding tool experiment, the Surfcorder SEF-3500 surface roughness gauges the surface roughness Ra values of the radial cutting surface and the radial clearance surface, and the experimental configuration and measurement data are used to construct a tool grinding accuracy prediction system using Abductive polynomial network. This system helps tool sharpeners to improve their tool grinding accuracy. A polynomial network model of the radial cutting face and radial clearance face of an end mill tool is presented in Figures 7 and 8, respectively. The error between the prediction system and the actual grinding surface roughness is within 7%, so it can be proved that the multinomial network prediction system built in this study can effectively predict the accuracy of tool grinding..jpg)
5.3 Effect of tool edge shape on high-speed cutting
The third stage of this study is to investigate the effect of tool edge shape on high speed cutting, based on the best cutting parameters of the first stage (cutting angle:30 degrees, clearance angle:11 degrees, cutting speed:4188.67 mm/sec and cutting depth:0.03mm) as the basis for tool edge simulation.
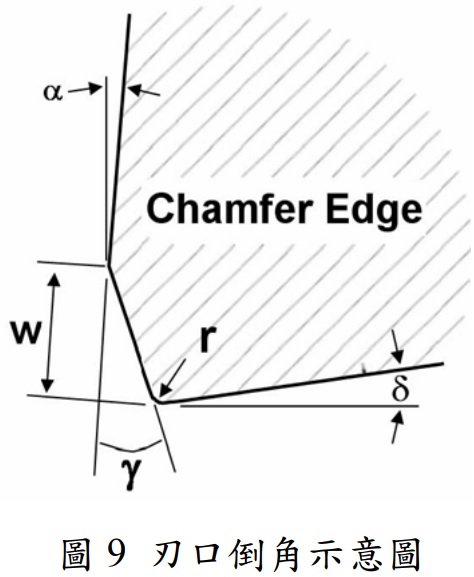
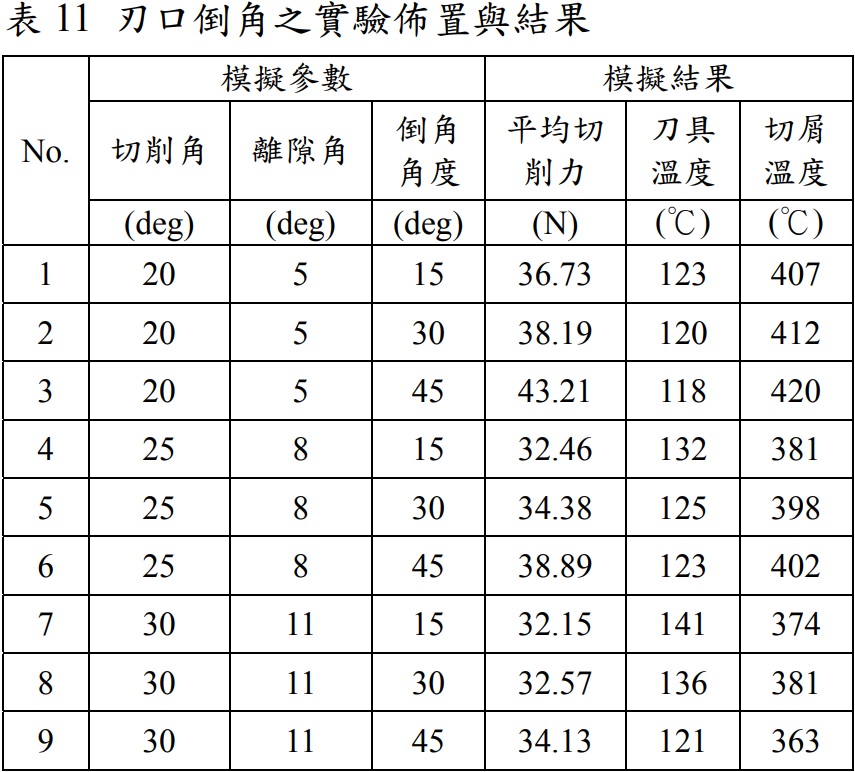
5.3.1 Experimental planning of simulated tool edge chamfer
First, fixed cutting speed and depth of cutting, in addition, the combination of cutting angle and clearance angle is divided into three groups, respectively, for the chamfer angle of the cutting edge 15, 30 and 45 degrees for simulation analysis, the tool geometry schematic diagram is shown in Figure 9, where α is the cutting angle, δ is the clearance angle, γ is the chamfer angle, w is the chamfer length and r is the contact round angle, in the tool edge chamfer model, the fixed parameters w is 10μm and r is 0. The evaluation simulation results are the average cutting force, tool temperature and chip temperature, the simulation planning and results, as listed in Table 11. From the simulation results in Table 11, it can be seen that when the chamfer angle is 45 degrees, the average cutting force will be greater but the tool temperature will be lower in the three sets of cutting angle and clearance angle combinations, while the chip temperature will not change significantly. On the other hand, in the simulated combination of a cutting angle of 20 degrees and a clearance angle of 5 degrees, the difference between the average cutting force and tool temperature from 15 degrees to 45 degrees is 6.48(N) and 5 degrees, respectively, with a greater change in average cutting force and a smaller change in tool temperature.In the simulated combination of 30 degree cutting angle and 11 degree clearance angle, when the chamfer angle changes from 15 degrees to 45 degrees, the difference between the average cutting force and tool temperature is 1.98(N) and 20 degrees, respectively, with a smaller change in average cutting force and a larger change in tool temperature.
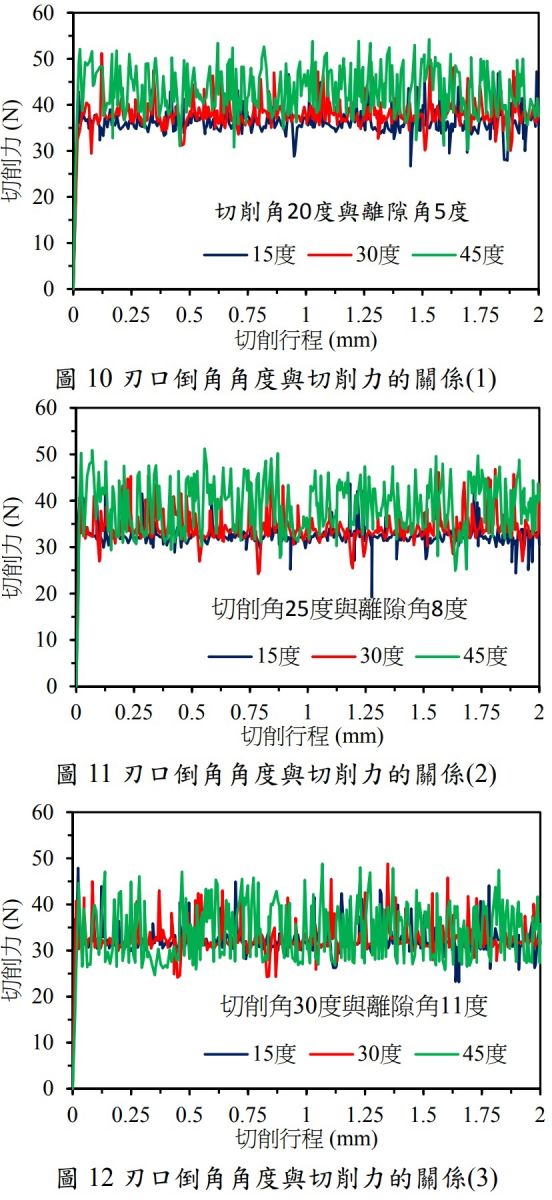
From the above analysis, it can be seen that when the cutting angle is 30 degrees, the clearance angle is 11 degrees (first stage optimal tool geometry) and the cutting edge chamfer is 45 degrees, the average cutting force during the simulated cutting is larger but there is no significant difference, but the tool temperature difference is 20 degrees. Figures 10 to 12 show the relationship between the chamfering angle of the edges and the cutting force.
5.3.2 Edgewise chamfering verification experiments
In this study, we will use actual cutting to verify the feasibility of the cutting pattern of the tool edge shape created by DEFORM- 2D software. The validation experiment was carried out on a high-speed integrated machining machine of the Schwarzer B8 type. In the verification experiment, reverse milling was performed with the same cutting speed of 4188.67 mm/sec, 0.03 mm per flute feed (depth of cut), 1.0 mm axial depth of cut and 1.0 mm radial depth of cut, and the relationship between the effect of the shape of the tool edge on the high speed milling SKD61 die rig was simulated and examined. The experimental results are presented in Table 12.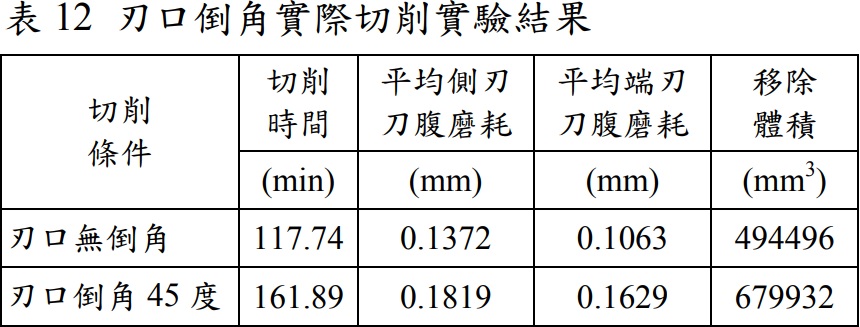
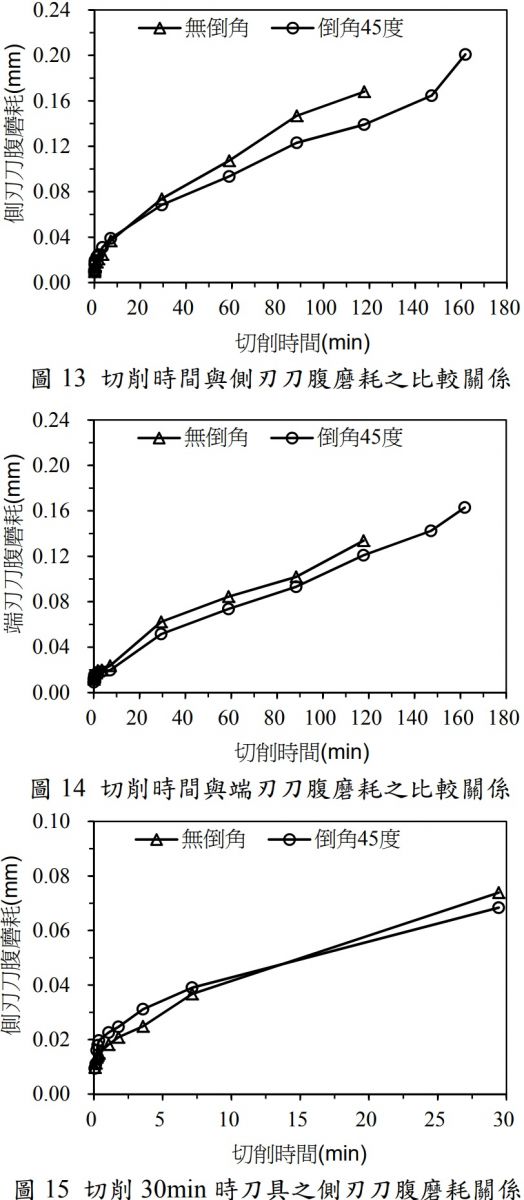
From the actual cutting results in Table 12, it can be seen that the flat end mills with 45 degrees of chamfering have better cutting performance with 44.15(min) more cutting time and 185436(mm3) difference in removal volume under the same cutting conditions. Figures 13 and 14 show the relationship between the cutting time of a flat end milling tool with no chamfering and 45 degrees of chamfering on the flank and end-edge tool belly wear.
It is worth noting that a square end milling tool with a 45-degree chamfering of the cutting edge has greater side-cutting web wear than a square end milling tool with no chamfering of the cutting edge 15 minutes before cutting, as shown in Figure 15. This phenomenon is caused by the fact that chamfered tools are subjected to a higher cutting force than non-chamfered tools, but after 15 minutes of cutting, the amount of tool web wear of chamfered tools is smaller than that of non-chamfered tools. This is because non-chamfered tools (sharp edges) are subjected to an instantaneous cutting force at the beginning of cutting, which causes uneven breakage of the edges, which in turn affects the change of tool web wear during subsequent cutting, proven experiments have proven this method to be effective in improving the tool life of flat end milling tools for high speed cutting of SKD61 dies.
The ANOVA analysis of the simulated high-speed cutting SKD61 die steel reveals that the tool geometry and cutting parameters affect 52.904% and 47.096%, respectively, of which 40.223% depth of cut and 30.201% angle of cut are the most important factors for the design of high-performance end mill tools. The Abductive polynomial network is used to predict the surface roughness of the radial cutting surface and the radial clearance surface of the grinding tool using the tool grinding conditions to improve the surface integrity of the grinding tool. Finally, the design of the chamfering of the cutting edge reduces the sharpness of the cutting edge, so that it can show a stable wear of the tool belly at the initial cutting stage and increase the life of the tool, and through the understanding of the key factors that affect the high speed cutting SKD61 die steel and the use of the tool grinding parameter prediction system to improve the precision of tool grinding, and finally with the design of the cutting edge shape to improve the tool life.
6. Self-assessment of project results
In the first stage, the DEFORM 2D construction and milling model was used to find out the optimal tool geometry and cutting parameters for high-speed cutting SKD61 tooling. The results of the validation experiments illustrate the feasibility of the process parameter optimization algorithm and cutting simulation model with multiple quality characteristics proposed in this study. In the second stage, the Abductive polynomial network was used to construct a prediction system for tool grinding accuracy (radial cutting surface and radial clearance surface), and the error between the prediction system and the actual grinding surface roughness was within 7%, so it can be proved that the prediction system of the polynomial network constructed in this study can effectively predict tool grinding accuracy. In the third stage, based on the best tool geometry and cutting conditions of the first stage, DEFORM 2D software was used to design and analyze the tool edge shape, and a validation experiment was conducted to improve the tool life by chamfering the tool edge at a width of 10μm and 45 degrees. From the above three stages of analysis and exploration, the key factors for the design and grinding of high-performance end mills can be clearly analyzed, and this technology can be provided to the domestic tool grinding industry for the design and grinding of high-performance end mills based on the foundation and basis.