High Speed Milling SKD61 Solid Carbide End Mills for Die Steel Process Parameter Optimized Design
2020-06-08
Abstract
In this study, the Taniguchi method is used to investigate the design of process parameters for the optimization of end mills for high-speed milling of SKD61 die steel. The process parameters that affect end mill life are spindle speed, feed per flute, axial depth of cut, radial depth of cut, helix angle, radial cutting angle, radial clearance angle, axial cutting angle and axial clearance angle. In this paper, the Taguchi method is used to obtain the optimal combination of process parameters using end mill life as a performance indicator. The test results show that the optimum combination of process parameters obtained by the Taguchi method is effective in improving end mill life.
I. Preface
The demand for end mills milling workpieces has increased significantly due to the development of the aerospace industry, mold processing industry, automotive parts industry and 3C products, and the advancement of technology has made the precision of products boosts demanding. Cutting tools are very important technical end mills in the manufacturing industry, the quality of the end mill directly affects the cutting performance, edge wear, end mill life...etc. The sharpening of the flute edge of a end mill is the most important process in the manufacture of a end mill and is the key to determining the geometric accuracy and cutting performance of the end mill. SKD61 die steel has high toughness, high strength, abrasion resistance, easy cutting and surface treatment, etc. It has been used in the industry for making molds. The current processing method of SKD61 die steel is first rough cutting to the pre-cutting area, then grinding by hand, polishing and other processing processes, and then the test mold, and then the mold until it meets the requirements, very time-consuming and costly. Due to the high precision of high speed milling, the use of high speed milling can shorten the manual grinding and polishing time, significantly shorten the mold making cycle and greatly reduce the production cost and time, therefore, if the mold making can be efficiently processed by high speed milling, it will greatly help the competitiveness of the industry. Therefore, grinding the appropriate end mill geometry and choose the best cutting conditions to high speed milling SKD61 die steel, in order to improve the end mill life, reduce production costs, is the expectations of mold makers.
The cutting performance of roughing and milling processes is mainly based on end mill life, which is closely related to the process parameters, which include the geometric angle of the end mill and the cutting conditions. In order to obtain good cutting performance, not only the machine itself must have sufficient rigidity and dynamic characteristics, it is also necessary to choose the appropriate value of process parameters. A systematic and efficient test method is required to provide the best process parameter value.
In recent years, scholars have explored the optimization of cutting process parameters using end mill life as a performance indicator, and have provided many insights and studies on this topic. Scholar Cao Zhong applied the Taguchi method to investigate the most suitable cutting parameters for milling 6061 aluminum alloy with the end mill flank wear as a performance indicator. The study explores the influence of machining parameters on end mill wear (life), chip formation, chip form, cutting force and surface roughness, as well as the evaluation of the importance machining parameters when machining SKD61 die steel (40-53HRC) with a carborundum end miller with aluminum titanium nitride (TiAlN) coating. The effect of cutting conditions on end mill life and end mill wear was analyzed by Ping-Yin Li and other scholars using an aluminum nitride titanium-coated carbide corner radius milling end mill for high-speed milling of SKD61 die steel. The fuzzy Taguchi method was applied to investigate the optimal design of cutting parameters for heavy-duty machining of SUS304 stainless steel in side milling, using end mill life and metal removal rate as cutting performance indicators. Xie Yuhong researched the best end mill geometry design for cutting NAK80 die steel, using end mill life as the performance indicator, and applied the Taguchi method to explore the best horizontal combination of end mill geometry and angle parameters. The effect of end mill geometry on cutting performance during high speed cutting of SKD61 die steel was studied by Daijia Nguyen and others, and a multinomial network was used to construct the end mill wear prediction model.
As can be seen from the literature, most researchers in the past have looked for the most suitable process parameters solely on the effect of cutting conditions or end mill geometry on cutting performance. In this paper, a total of nine process parameters are combined with end mill geometry and cutting conditions. Within a certain range of process parameter values, the process parameters are explored to determine the optimal design of the end mills for high-speed milling SKD61 molds with end mill life as a performance indicator. In this paper, we first set up an experimental layout using an in-line table, used end mill grinding software with a 5-axis end mill grinder to grind the end mills required for the experiment, then performed high-speed milling of SKD61 die steel, and finally used the Taguchi parameter design to find an optimal set of process parameters. The results of the analysis can be used as a reference for the development of end mills for high speed milling SKD61 for the tooling industry or end mill manufacturing industry.
II. Set up the experiment
The purpose of this paper is to discuss the optimal design of end mills for high-speed cutting of SKD61 die steel with the end mill life as the performance index. The experiment was planned in two parts, end mill grinding and high-speed milling experiment. The end mills are grinding on a end mill grinder using 8 mm diameter tungsten carbide rods with a grinding wheel spindle speed of up to 6000 rpm, and the grinding end mills are measured at all geometric angles using a Zoller genius3 end mill measuring instrument.
The milling experiment used a B8 high-speed integrated machining machine with a maximum spindle speed of 22000 rpm. The test material is SKD61 die steel, hardness HRC40, workpiece size is 200 mm × 50mm × 80 mm. The end mill elongation is kept at 38 mm, static deflection is kept within 0.5 mm, end mill balance is measured by Haimer TD-99 end mill balance machine, end mill balance test is within 0.02G. The finished end mill is measured with an OLYMPUS STM5-BDZ 3D end mill microscope to measure the side edge and web wear of the end mill.
III. Experimental Design
1. Cutting performance evaluation
Experiments are used to evaluate cutting performance using end mill life as an indicator. In general, the longer end mill life, the smaller the end mill flank wear rate, therefore, this paper replaces the end mill life with the end mill flank wear rate. End mill flank abrasions are end-face end mill flank abrasions and side-edge end mill flank abrasions. The end mill flank wear rate is defined as follows.
End mill flank wear rate = average end mill belly wear/cutting time Equation(1)
2. Selection of process parameters and determination of their level
In order to reduce the experiments, this paper applies the direct-intersection table to the configuration and analysis of experiments, and still obtains the analysis effect very similar to that of the full-factor experiment, in order to achieve the purpose of reducing the number of experiments and cost. The main effects on end mill life are the cutting conditions and the geometry of the tool.
The cutting conditions are four parameters such as
(A)Spindle speed
(B)fz
(C)ap
(D)ae
The end mill geometry is mainly five parameters such as
(E)Helix angle
(F)Radial cutting angle
(G)Radial clearance angle
(H)Axial cutting angle
(I)Axial clearance angle.
In this paper, these nine process parameters are considered as controllable factors that affect end mill life, each of which can be set to three levels. The process parameters chosen for this experiment and their level are shown in Table 1.
Table 1 Process parameters and their levels
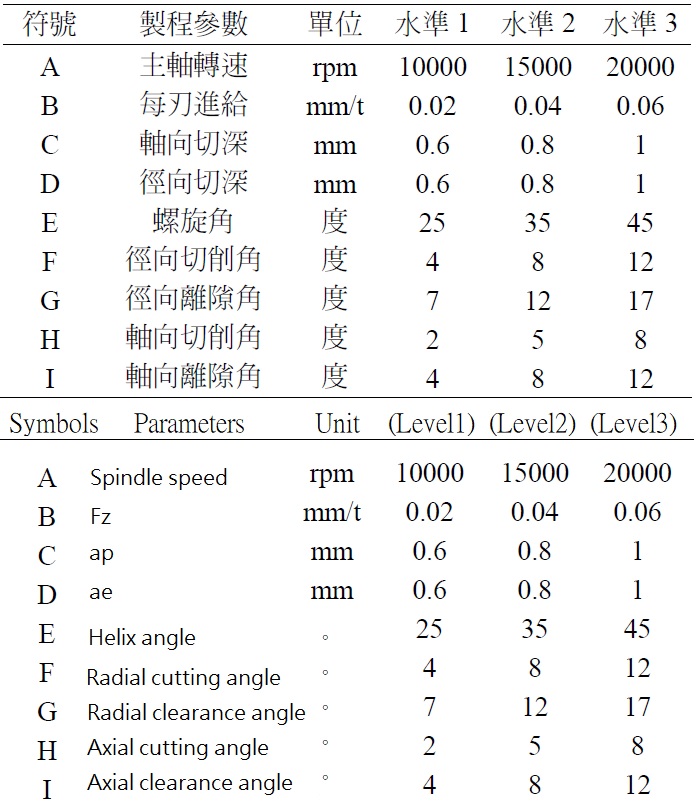
Table 2 Experimental setup
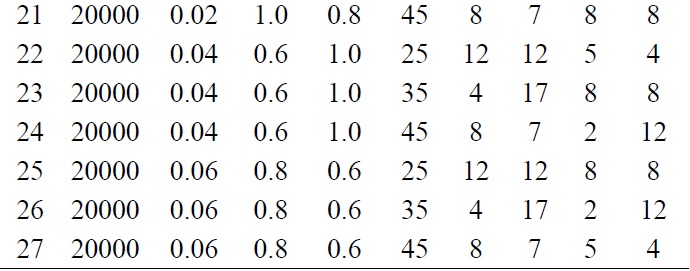
3. The selection of the orthogonal table and the experimental setup.
The choice of the orthogonal table is related to the total degrees of freedom of the process parameters. In the high speed cutting experiment, there are nine process parameters of the trihydrate accuracy, and the interaction between the process parameters is negligible in this planning experiment. The degrees of freedom process parameters must be greater than or equal to the following at least equal to the degrees of freedom of all process parameters, the L27 table has 26 degrees of freedom, so the L27 table can be configured with 13 degrees of freedom. Therefore, the L27 DC table is chosen for this experiment.
The process parameters are as follows: spindle rotation speed in the first row of the L27, feed of each flute in the second row, axial tangent, and the speed of the spindle in the first row of the L27. The radial depth of cut is placed in the third row, radial depth of tangent in the fourth row, helix angle in the fifth row, radial cutting angle in the sixth row, and radial clearance angle in the fourth row. The experimental arrangement is shown in Table 2.
The process parameters are as follows: spindle rotation speed in the first row of the L27, feed of each flute in the second row, axial tangent, and the speed of the spindle in the first row of the L27. The radial depth of cut is placed in the third row, radial depth of tangent in the fourth row, helix angle in the fifth row, radial cutting angle in the sixth row, and radial clearance angle in the fourth row. The experimental arrangement is shown in Table 2.
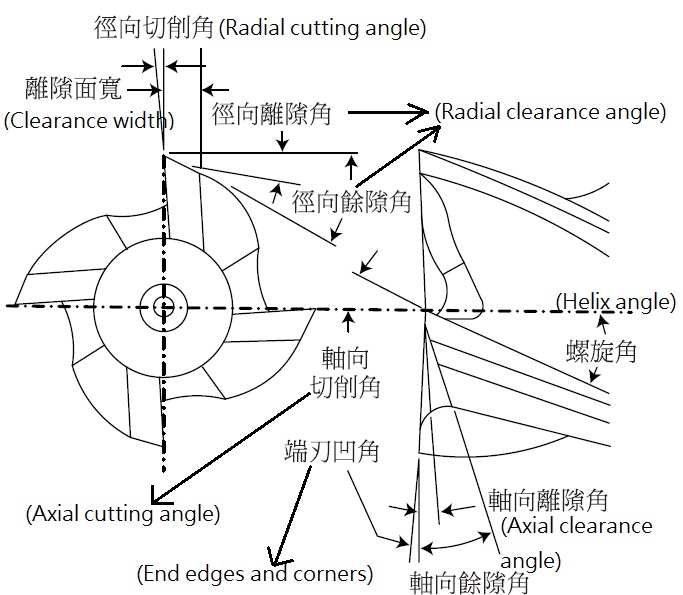
Fig. 1 Names of end mill parts
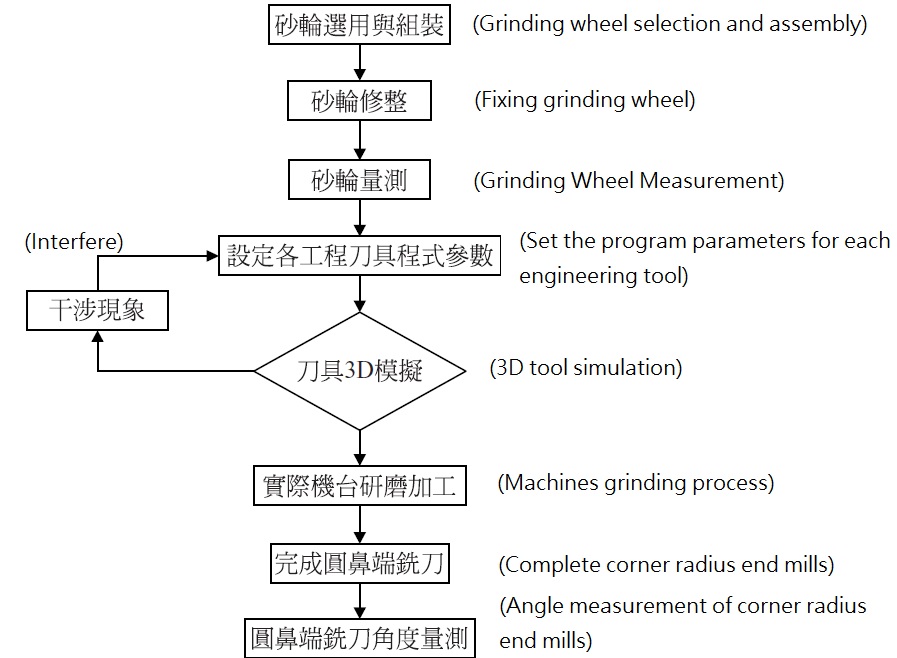
Fig. 2: Flow chart of corner radius end mill grinding process
There has 26 degrees of freedom, so the L27 orthogonal table can be configured with 13 trigonometric standard factors, thus meeting the requirements of this experiment. Select the L27 Direct Intersection Table. The process parameters are as follows: spindle speed in the first row of the L27 table, feed per flute in the second row, axial tangent in the first row, and tangent in the second row. The radial depth of cut is placed in the third row, radial depth of tangent in the fourth row, helix angle in the fifth row, radial cutting angle in the sixth row, and radial clearance angle in the fourth row. The experimental arrangement is shown in Table 2.
IV. Carbide End Mills Grinding
The end mills are consisting of shank and cutting flute edge, the shank is sintered into the holder, and the holder is mounted on a high-speed spindle for milling and machining. The cutting flute edge is the main part of the end mill, and the name of each part of the cutting edge is shown in Figure 1. Also, Figure 2 shows the flow chart of end mill grinding.
Table 3: Geometric Measurement Results of End Milling End Mills
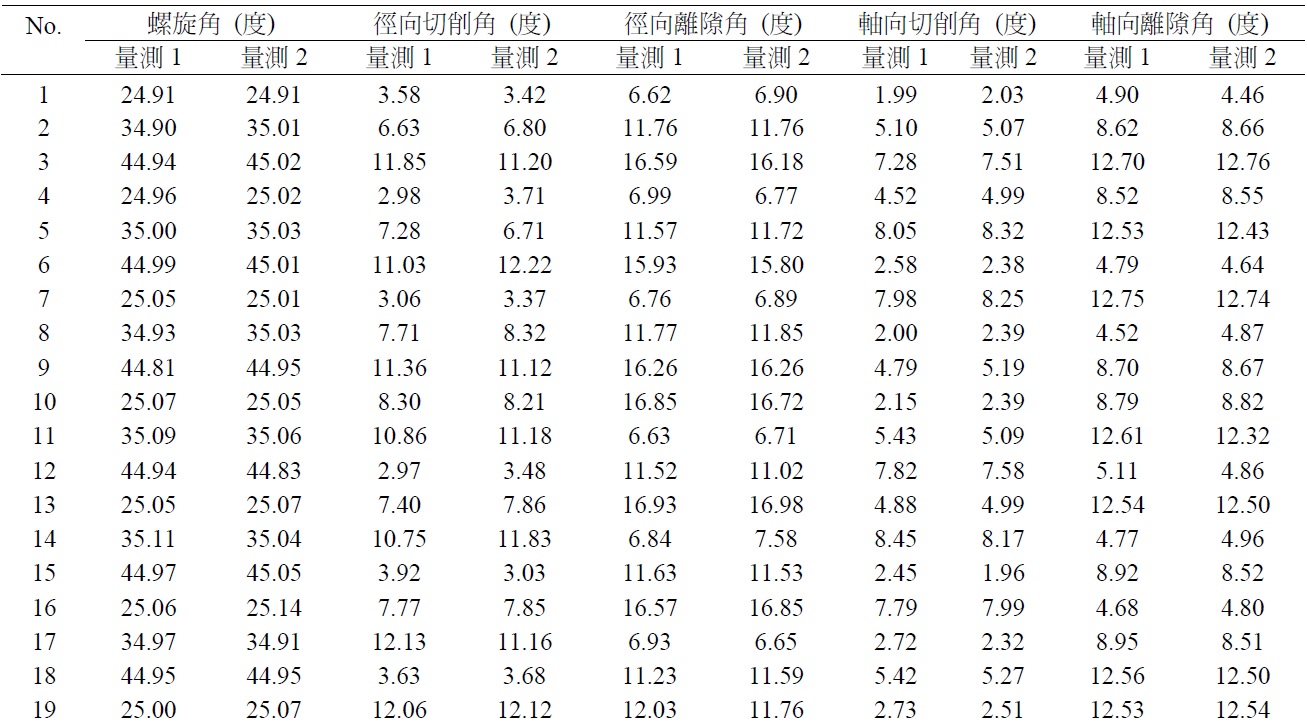
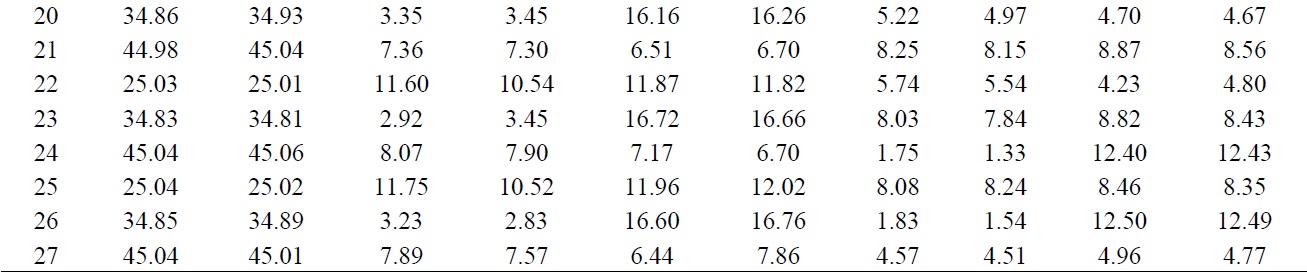
The end mill grinding part is made of 8 mm diameter tungsten carbide bar. End mill grinding software with TG-5PLUS 5 axis end mill grinder to grind the end mills required for experiments. Grinding procedure: radial cutting angle (with helix angle), axial cutting angle, radial clearance angle (with concave clearance), axial clearance angle. Each end mill is grinding in a geometric combination of two end mills. The grinding end mills are then subjected to end mill geometry measurement with the end mill angle measuring instrument Zoller genius 3. The table below shows the results of the geometric measurement of the end mills. Fig. 3 shows the picture of the grinding end mills.
5. Milling experiment
After grinding end mills with different end mill geometries on the 5-axis end mill grinder, high speed milling of SKD61 die steel is performed. The experiment is performed by air-blast machining on the B8 high-speed machining center. Figure 4 shows a schematic diagram of high-speed milling experimental machining.
Fig. 3. Solid End Mills Photo
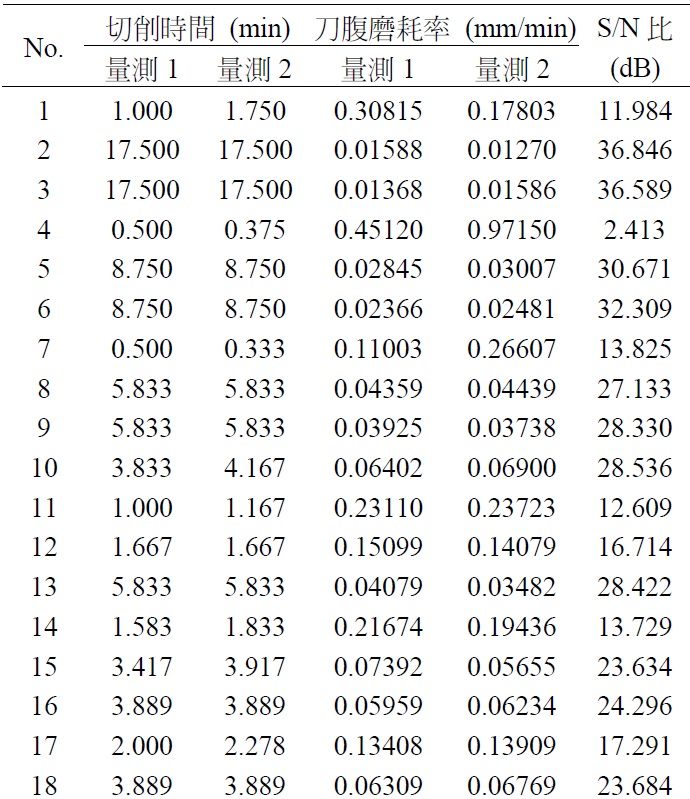
According to the combination of process parameters shown in Table 2, the milling of SKD61 die steel will be carried out sequentially. The experiment is finished when the maximum total length of continuous milling reaches 20 m or when the end mill’s flank breaks down (with a long spark). When required for cutting and placing the end mill under a end mill microscope with 100x magnification (OLYMPUS STM5-BDZ) where the end mill’s flank wear is measured on. As shown in Fig. 5, the end flute wear of corner radius end mill is measured at four points, A, B, C, and D. The end flute wear of corner radius end mill is measured at the following four points. The four points (E, F, G, and H) are the flank wear of the corner radius end mill. In this paper, the average of the wear at 8 points (A, B, C, D, E, F, G, H, etc.) is divided by the cutting time to obtain the flank wear. The rate is used as the basis to judge the end mill life. The experimental results are shown in Table 4.
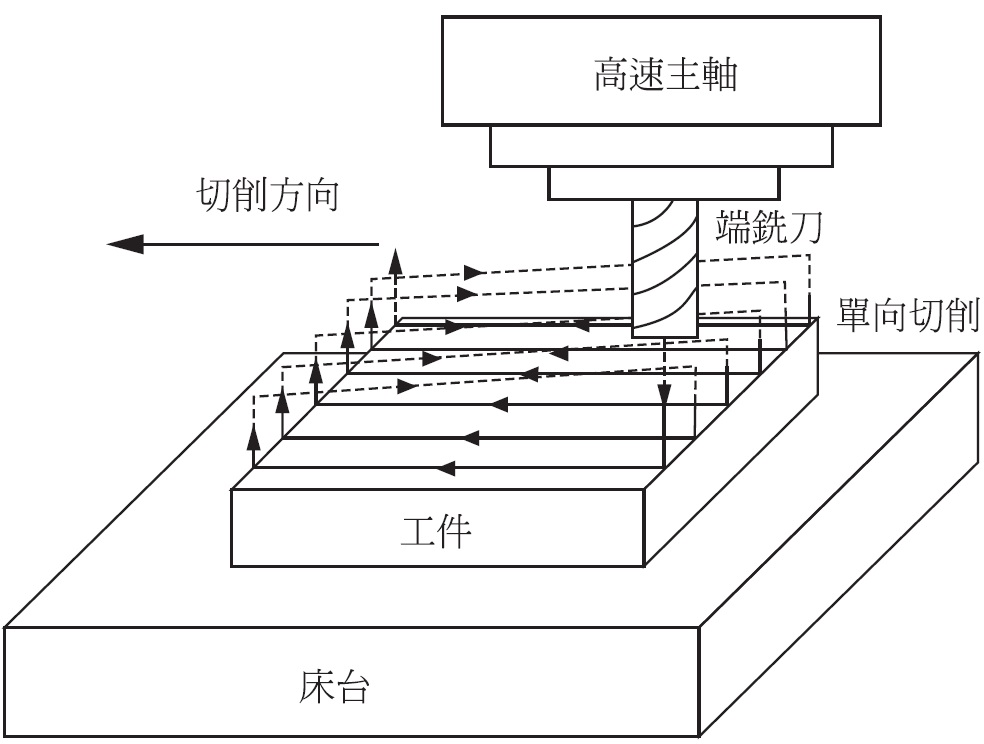
Fig. 4 Experimental Machining for High Speed Milling
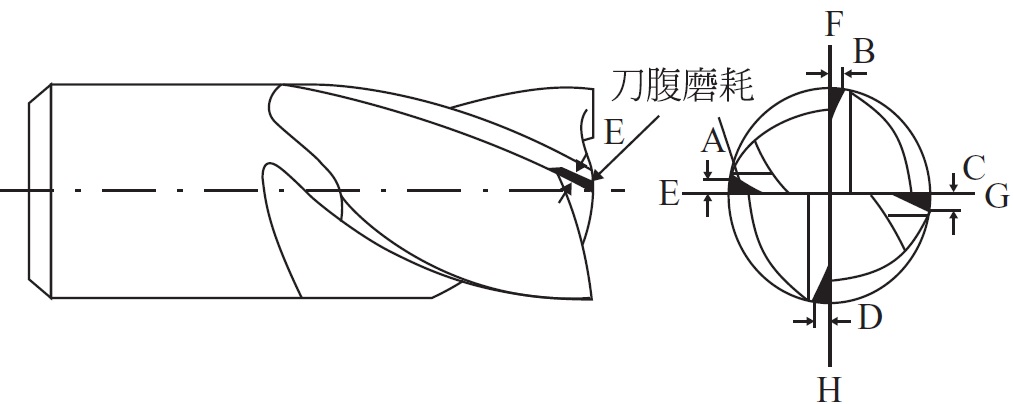
Fig. 5: Diagram of End Milling Tool Flank Wear Measurement Points
VI. Analysis and Discussion
The quality characteristics of the wear rate of the end mills flank are obtained through the milling experiment.
(1) Convert the experimental results into S/N values.
(2) Use the S/N value as the average S/N value for each factor level.
(3) Find the best combination of process parameter levels by using the S/N value response table.
(4) Variance analysis.
(E) Conduct confirmation experiment.
1. S/N ratio calculation
In the Taguchi method, each quality characteristic is converted into an S/N ratio, and the S/N ratio is used to find the design with the best quality and the least variation. In the Taguchi method, quality characteristics are divided into three categories: small, large, and extra-large. The longer the end mill life and the smaller the wear rate, the better the cutting performance, therefore, the wear rate of the end mill is the smallest characteristic. The formula of S/N ratio is.
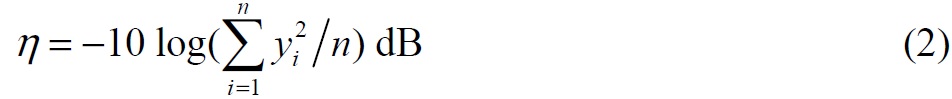
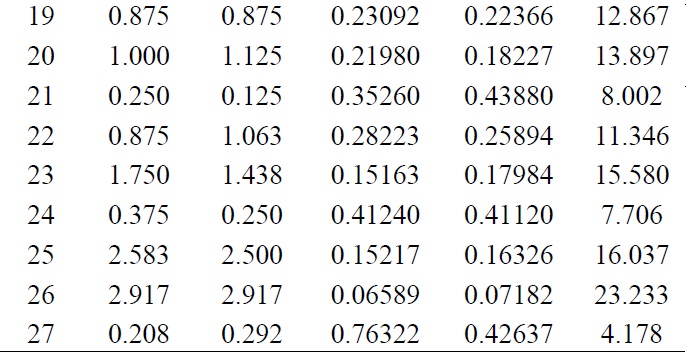
Where yi is the value of each group in the i- experiment, n is the number of experiments for each group, and n is 4. Replace the experimental results listed in Table 4 with the equation (2) to S/N. The results are listed in the rightmost row of Table 4. In general, the larger the S/N ratio, the better the quality characteristics.
Where yi is the value of each group in the i- experiment, n is the number of experiments for each group, and n is 4. Replace the experimental results listed in Table 4 with the equation (2) to S/N. The results are listed in the rightmost row of Table 4. In general, the larger the S/N ratio, the better the quality characteristics.
2. Process parameter optimization level combinations
Table 4: Experimental results and their corresponding S/N ratios
The main purpose of the S/N ratio response table is to determine the optimum level for each factor. According to the definition of S/N ratio, the higher the S/N ratio, the better the quality (less loss). Therefore, choose a level where each factor S/N is larger than the other.
From the S/N ratio in Table 4, calculate the average value of each level for each control factor and the result is shown in Table 5. When the S/N ratio increases, the process variation and the average value will decrease. The best combination of parameters is the specific parameter combination, therefore, from the S/N ratio response table in Table 5, we can see that each process parameter is optimal. Levels: Spindle speed in the first level (10000 rpm), feed per flute in the third level (0.06 mm/t), axial depth of cut in the first level (0.6 mm), radial depth of cut in the first level (0.6 mm) mm/t), the helix is using second level (35°), radial cutting angle (8°), and radial clearance angle is using third level (17°), axial clearance angle for the first level (2°) and the third level of axial clearance angle (12°). The optimal combination of process parameters is A1B3C1D1E2F2G3H1I3. Table 5 shows that, within the given range of process parameters, the effects of process parameters on quality characteristics are as follows: radial clearance angle, spindle speed, helix angle, radial cutting angle, radial depth of tangent, axial clearance angle, axial depth of tangent, axial cutting angle, and feed per flute.
Table 5: S/N Ratio Response of End Mill Wear Rate
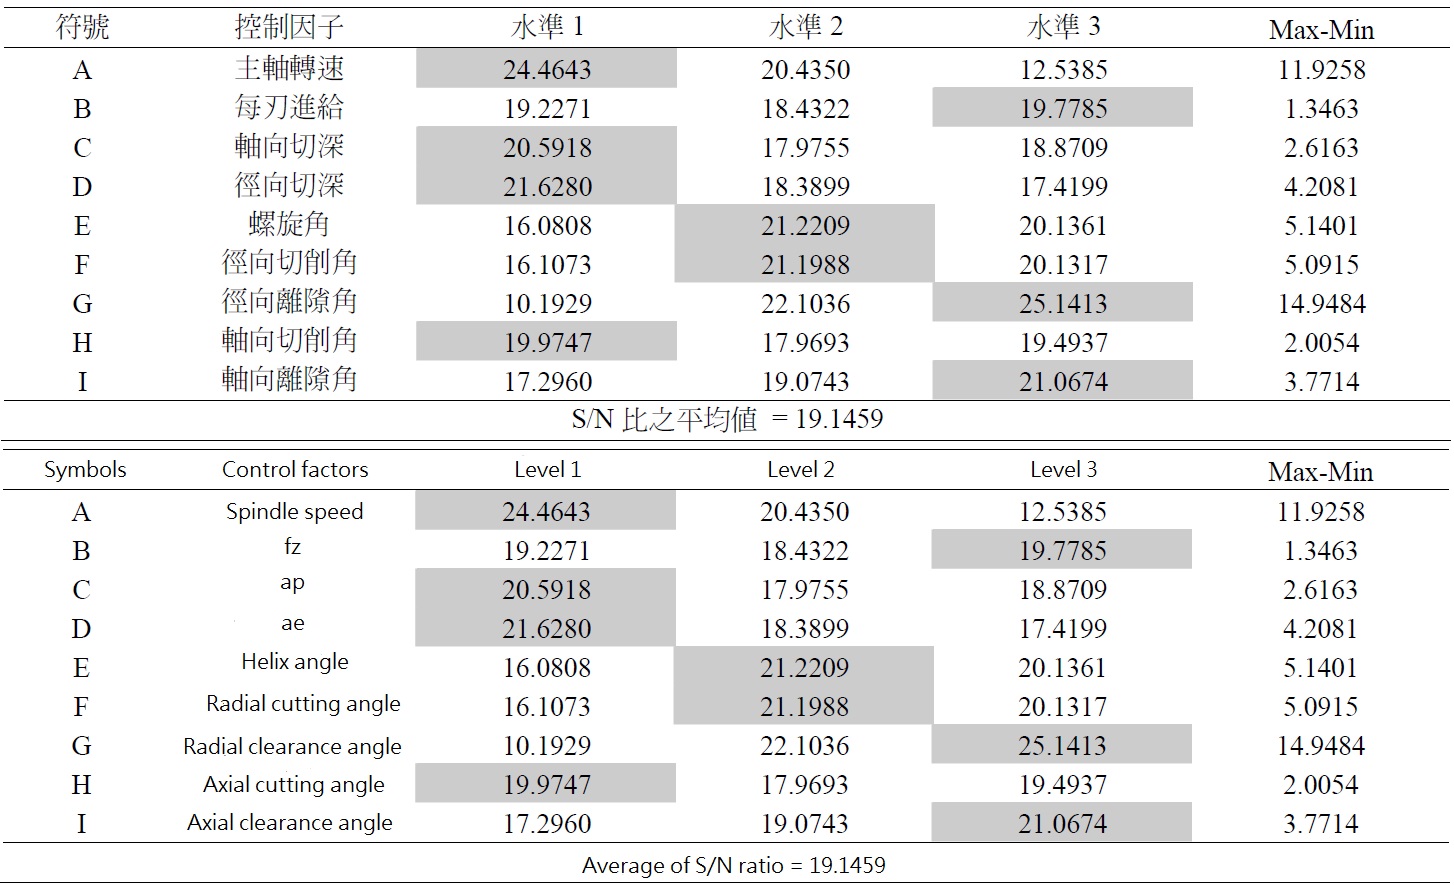
Table 6: Analysis of S/N ratio variation of end mill wear rate
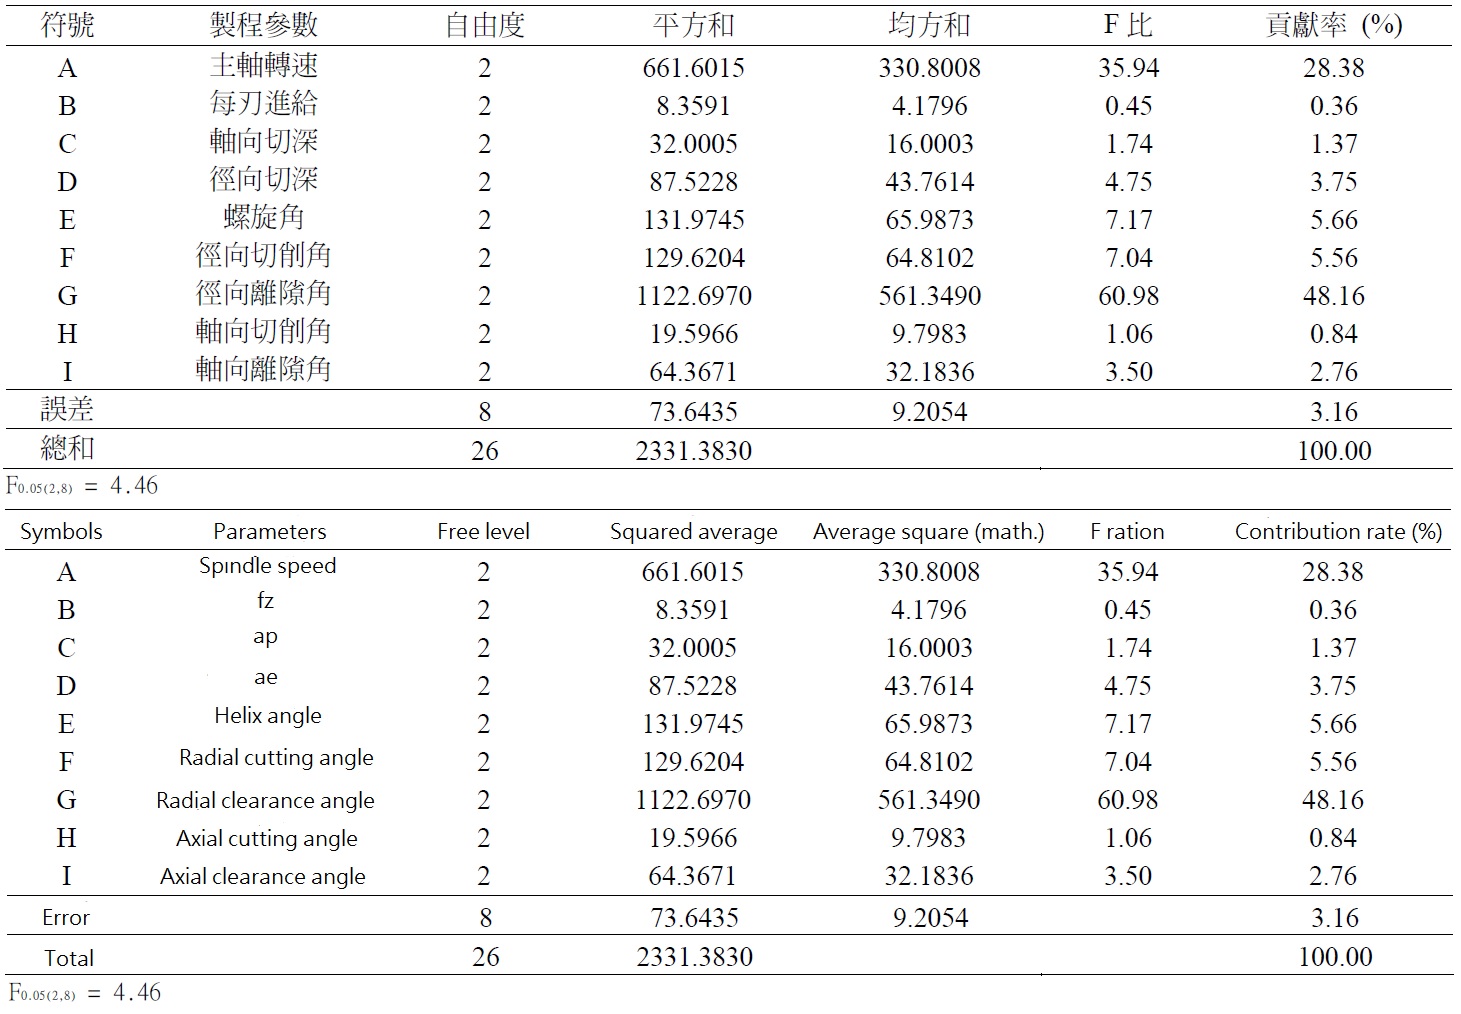
Although the S/N ratio can identify significant control factors that affect the milling process, the factors usually also cover the experimental errors. In order to obtain more accurate information, variation analysis can be performed. Variation analysis can decompose the variation caused by each control factor and error, and provide the output variation of each control factor on the engineering system. More specific data analysis.
The variance analysis of the S/N ratio depends on converting each quality characteristic value from each experiment to an appropriate S/N ratio, and then using the S/N ratio as the basis. STATISTICAL software was used to analyze the variance of the S/N ratio of the abdominal wear rate in Table 6, and the results are shown in Table 6. As shown. From the variance analysis, we can see that the significant control factor (F ratio > F0.05(2, 8) = 4.46) radial clearance angle (G), spindle speed (A), helix angle (E), radial cutting angle (F), radial depth of cut (D).
The percentage of error items, ) error, can be used to assess the appropriateness or adequacy of the experiment, since error items (error) is related to an uncertainty or uncontrollable factor other than the control factor. Based on experience, if error ≤15%, it can be considered that the experiment has not ignored some important factors; if error ≥50%, it can be inferred that some important factors have been neglected and the experimental results will not be satisfactory. In this study, from the variation table of the end mill flank wear rate, it can be seen that the maximum contribution of the variation caused by the error factor is 3.16%, it means that the selection and arrangement of control factors in this experiment are appropriate and reasonable, and the results of this experiment have a high degree of reliability.
4. confirm the experiment
In order to verify the success of the proposed algorithm, the additive model and the confidence interval in Taguchi's method are applied. According to the S/N ratio indicates in Table 5, the optimal combination of process parameters is as follows A1B3C1D1E2F2G3H1I3. First, we use the additive model to calculate the S/N of the optimal level combination of process parameters. S/N ratio. S/N ratio prediction for the best combination of process parameters.
Npredicted is calculated as follows.
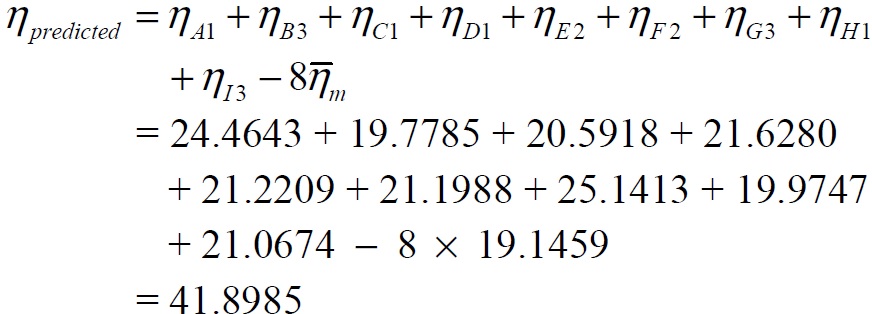
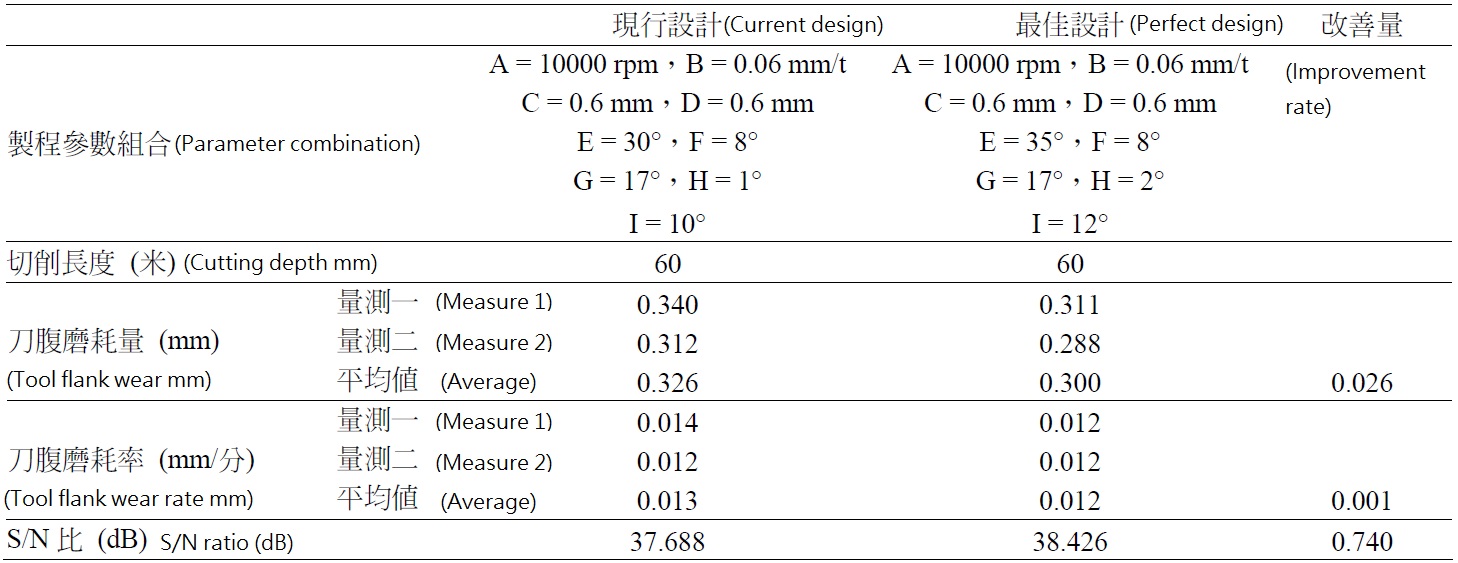
The verification test is conducted according to the geometric angle of the end mill produced by WOTEK and the best geometric angle obtained in this study. Table 7 shows the results of the geometric measurement of the end mills used in the validation experiment. Table 7 shows the results of the geometric measurement of the end mills for the confirmation test. The results of the confirmation test are shown in Table 8. The confirmation experiment shows that the S/N ratio of the best process parameter experimental value is 38.426 dB, which is very close to the predicted value, and it is shown in Table 8. The "additive model holds" and shows that the experimental value of the optimal combination of process parameters is reproducible.
Npredicted is calculated as follows.
The verification test is conducted according to the geometric angle of the end mill produced by WOTEK and the best geometric angle obtained in this study. Table 7 shows the results of the geometric measurement of the end mills used in the validation experiment. Table 7 shows the results of the geometric measurement of the end mills for the confirmation test. The results of the confirmation test are shown in Table 8. The confirmation experiment shows that the S/N ratio of the best process parameter experimental value is 38.426 dB, which is very close to the predicted value, and it is shown in Table 8. The "additive model holds" and shows that the experimental value of the optimal combination of process parameters is reproducible.
Table 7: Confirmation of geometric measurement results of end mills for experiments
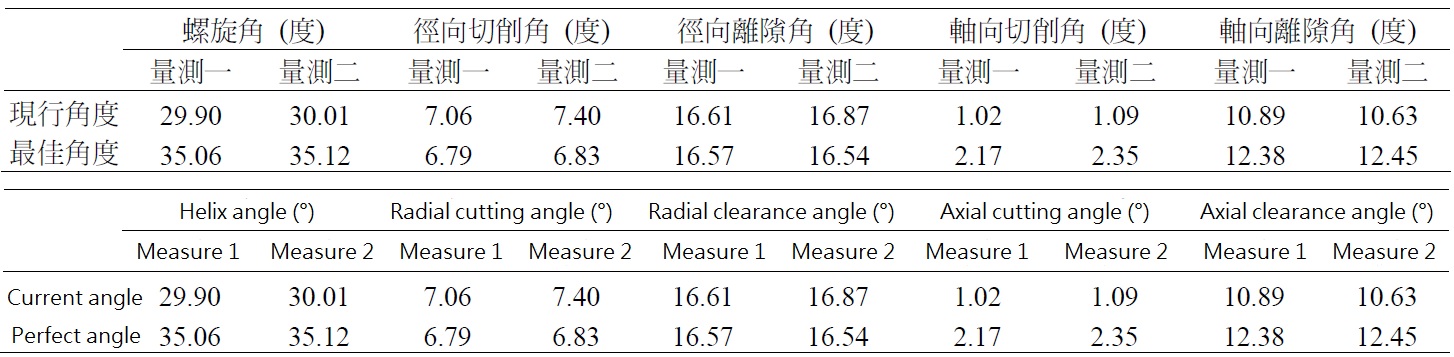
Table 8 Comparison of the current process parameter design with the best process parameter design
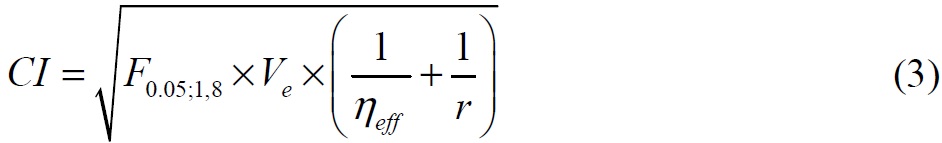
The confidence interval (CI) to confirm the expected mean of the experiment is Npredicted ± CI and the CI is calculated as follows.
In the formula
Ve = Variance
1 Neff
Total number of experiments/
Significant factor degrees of freedom and +1
r = number of repetitions to confirm the experiment, r = 2 in this paper
This paper confirms that the experiment was done twice, so
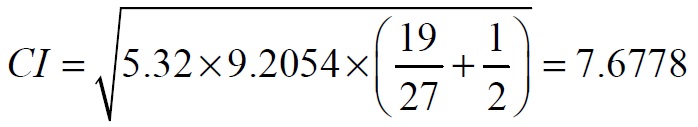
The 95% confidence interval is 41.8985 ± 7.6778, or 49.5763 ≤ Npredicted ≤ 34.2207.
Table 8 confirms that the experimental S/N ratio of 38.426 dB falls within the above range, which shows that the chosen S/N ratio of this paper is within the range of 38.426 dB. The significance factor is appropriate and correct, i.e. the experiment is successful.
To conduct milling experiments with end mills of the current design under the cutting conditions in this study and compare the results with those of the best process parameters experiments. The results are shown in Table 8. From Table 8, it can be seen that when the milling length is up to 60 m, the amount of wear on the end mill flank is reduced from 0.326 mm to 0.300 mm. The S/N ratio increases from 37.688 dB to 38.426 dB. Fig. 8 shows the relationship between the milling length and the amount of wear on the end mill flank when the milling length reaches 60 m under the current design process parameters and the best design process parameters. Fig. 8 shows the relationship between the cutting length and end mill wear under the current design process parameters and the best design process parameters. The solid curve is the current design and the dashed curve is the best design. This shows that, at any given time, the best-designed end mill has less flank wear than the current-designed end mill, i.e. the best-designed end mill has less flank wear. The ideal designed end mills will have longer end mill life.
VII. Conclusion
This study investigates the design of the optimal process parameters for end mills for high-speed milling of SKD61 die steel with end mill life as the performance index. The conclusions are summarized as follows
Under.
1. The analysis of the variation shows that the radial clearance angle has the most significant effect on the wear of the end mill’s flank, with a contribution of 48.16%. Therefore, when designing the end mill geometry, the radial clearance angle is one of the most important control factors.
2. The significant controlling factors affecting end mill’s flank wear are radial clearance angle, spindle speed, helix angle, radial cutting angle, radial tangent angle, and radial clearance angle. The total contribution was 91.51%.
3. The confirmation experiment, it is shown that the S/N ratio of the experimental value of end mill’s flank wear is very close to the predicted value of S/N ratio, which illustrates the addition. The model holds, and shows that the experiments with the best combination of process parameters are reproducible. The S/N ratio falls within the 95% confidence interval of the predicted value, i.e., the experiment is successful.
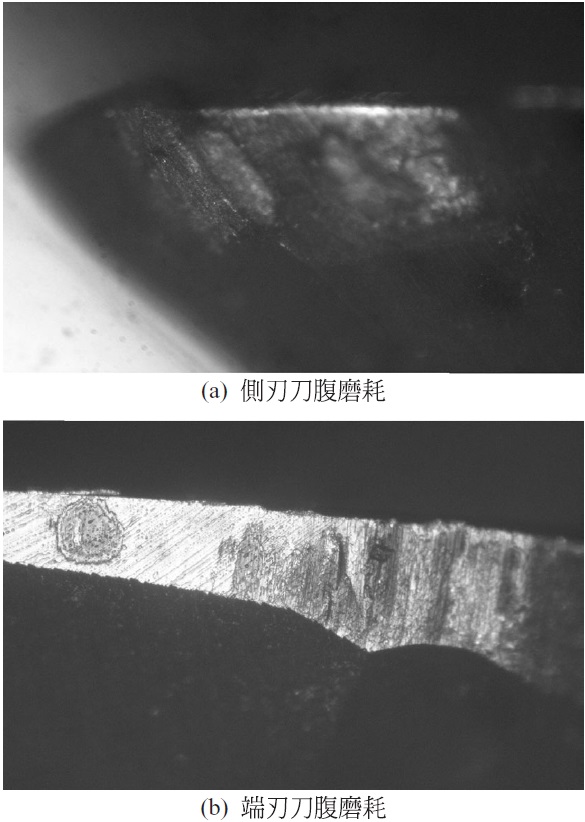
Fig. 6. High speed milling of SKD61 die steel with 60 m side and end flutes at optimum process parameters.
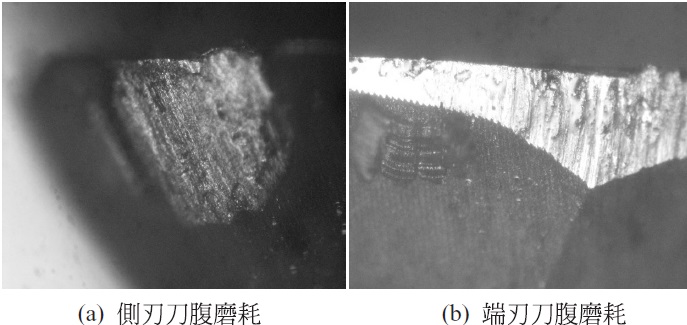
Figure 7. High speed milling of 60 m side and end flutes of SKD61 die steel at current process parameters.
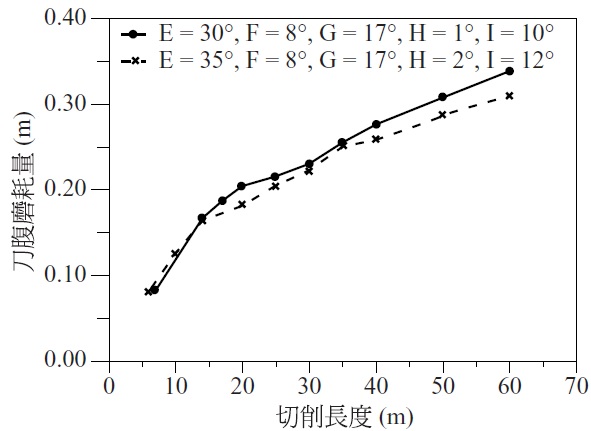
Fig. 8 Relationship between cutting length and grinding capacity (Cutting conditions A = 10000rpm, B = 0.06 mm/t, C = 0.6 mm, D = 0.6 mm).
4. The optimum combination of process parameters obtained from the design of the Taguchi parameters is A1B3C1D1E2F2G3H1I3. Confirmation experiments show that the wear of the end mill’s flank is reduced by 8.8%.
5. The design of the field parameters can be used to solve the problem of optimizing the design parameters of the end mill process. A reference for end mill manufacturers or end mill users seeking the best end mill geometry and cutting conditions.