Energy Usage Analysis of Carbide End Mills on AISI 1045 Steel
2020-05-20
Abstract
Machining and manufacturing processes have a strong influence on industry development and economic growth. Many important factors have been studied in order to optimize these processes. Over the last few years’ energy and power have been used as parameters to verify the efficiency of these processes. Monitoring the state of energy consumption may serve as an indicator of the manufacturing process behavior. The main challenge is to translate the energy usage into a practical indicator, since monitoring energy presents a challenge due to the dynamic characteristics of the machines and the diversity of associated factors interacting with each other during the machining processes. Tool wear and tool life expectancy are other important issue that have a significant impact on both, cost and efficiency, especially, in computer assisted processes. Although it has been continuously studied over many years, until now, monitoring the state of tool wear has remained a complex task. Thus, in this study, a specific type of carbide end mill is analyzed using, a potential energy approach. The energy limit for a cutting tool with specific physical and chemical features will be estimated since it can simplify the tool life estimation and the tool change timing prediction. A series of experiments are performed with carbide end mills on AISI 1045 steel, periodically measuring the tool wear and the required energy until the end of tool life, to analyze if a cutting tool could transmit a specific amount of energy to the work piece material before reaching the end of its useful life.
1. Introduction
The interaction between the cutting tool and work-piece has been an important area of research in the machining field for many years. Tool wear presents a challenge every time it should be estimated from an ongoing machining process to real time quantitative values. Most of current methodologies that attempt to address this problem do not allow optimal comparison of all the various factors affecting the machining process, such as the different cutting tool materials, cutting tool geometries, work-piece materials, work-piece geometries, cutting conditions and vibrations. Most of today’s guidelines are only useful for comparative purposes, such as ranking the expected levels of tool life depending on a specific material under certain cutting parameters. Even though this type of guideline could be used as a starting parameter, it cannot be expected to yield an accurate estimate of tool life in a given application unless prior application data for similar conditions are available. The objective of this paper is to analyze if a particular cutting tool could deliver a fixed amount of energy every time it reaches the end of its useful life, and understand which parameters are involved in the energetic exchange process. A series of experiments were performed, analyzing the total amount of energy usage for a carbide square end mill to reach an average flank wear of 0.3 mm under different cutting conditions.
1.1. Literature review
Analyzing tool wear or energy demand requires the use of diverse sensors. While each of these sensors can provide certain information about the process studied, some sensors offer greater challenges than others. Depending on the structure of the sensor, special consideration is needed in experimentation, such as the inability to use lubricant fluid or the need to use special shielding to protect the sensor from scattering material. Over the past several years cutting force measurements have been used regularly because they clearly reflect the cutting tool condition. However, in real life applications can become complicated the use of dynamometers for tool monitoring, which is relatively expensive equipment and the force sensors need to be located close to the cutting environment, requiring sometimes additional attention.
Most manufacturing companies usually manage tool control by focusing on the simple characteristics of the process, characterizing tool life by the working time of the tool without adjustment or replacement, by the number of parts produced, by the distance or tool path length, by the machined surface area, or by the linear relative wear. Although these types of parameters can offer certain support for process planning, it should be noted that they are easily disrupted by changes, such as the increase of the production rate. Most of these criteria do not allow the optimal control of cutting operations, the comparison of different cutting regimes, assessment of different cutting tool materials, etc.
Another approach that has been studied over the past few years is power and energy monitoring. Measuring power appears to be a good method due to the advantage that sensors are located far from the cutting process, yet it is still possible to extract direct information about the process behavior. The energy consumed in the machining processes is a matter of investigation, not only for its environmental impact, but also as an indicator for other phenomena during the machining processes. Cutting speed has been considered as an objective parameter to analyze tool wear because other known parameters are determined using criteria based on organizational conditions rather than technical conditions, such as highest productivity, minimum cost per part, etc.
However, it is still difficult to find an obvious relationship for wear prediction when considering all the factors that affect wear. Flank wear is a major form of tool wear in metal cutting, affecting the surface finish, residual stresses and microstructural changes in the form of the re-hardened surface layer. Therefore, the tool flank wear land width is often used to characterize the tool life. Another parameter affecting both, the tool life and energy usage is the rate at which the material is removed. Material removal rate and energy consumption can be incorporated together through the thermodynamic concept of exergy. The advantage of using exergy is that it allows the material and energy inputs and outputs to be expressed in the same unit, usually in joules (J). Exergy therefore measures the potential of a material to do work. Fuels naturally have high values of exergy; many other working materials, including metals, plastics and other organics can have equal values. The energy analysis allows the rational comparison of different energy forms and different process structures.
This concept is important for the present analysis, because the main objective in this research is to determine whether a cutting tool transmits a fixed amount of energy from the spindle motor to the work-piece regardless of the cutting conditions. It should be noted that the capacity of the machine tools, the tested material types, and the variance of process parameters have a significant impact on the energy consumption of the machine tool, which lead to the uncertainties of deriving such generic models, as each machine tool is a complex and dynamic system. Also temperature variation, which is difficult to measure, can cause periodic expansion and contraction of the tools leading to the formation of thermal cracks, leading to tool wear and chipping. Flank wear plays a significant role in determining tool-life for a range of industrial cutting conditions. According to the ISO3685 standard for tool-life testing with single-point tools, an average flank wear tool-life criterion of 0.3 mm is recommended.
A machining process involves significant friction at the tool/work-piece interface, such that the actual work requirement for the plastic deformation is provided by the spindle motor of the machine tool, the spindle drive thus represents an adequate point of measurement. During the milling process, the work-piece material is shaped by the plastic deformation that occurs due to the cutting tool and work-piece interaction. As a result of this interaction, energy is transformed and tool wear occurs. In order to achieve the desired state of plastic deformation, a certain amount of energy needs to be invested. This energy in the milling processes is provided by the spindle motor and delivered by the cutting tool. Because of this close relationship between plastic deformation and the cutting tool, it is important to determine whether a cutting tool with specific characteristics has a fixed amount of energy that can be used for a cutting process before reaching the end its useful life. If so, this could be extremely beneficial for the development of monitoring systems, production costs, and process planning.
Many studies characterizing energy usage rely on mathematical or statistical models because they provide a well-fitting characterization of the machine tool’s behavior for specific conditions without the need to consider the complexity of the physics involved. However, this could also be regarded as a disadvantage, as none of the terms used in the mathematical models have any physical meaning. Tool wear is an important limitation to machining productivity and part quality. Nowadays, spindle power data are easy to collect directly from modern machine tools and can be made available in production floor for such real-time data processing.
2. Theoretical background
Tool wear analysis has been traditionally studied through the cutting force framework because it provides a good indication of the cutting tool condition. Cutting force and power are related through the basic physical relationship shown in equation 1.

Where P is the cutting power demand in the tool tip in Watt or Joules/second, F is the cutting force measured in Newton and V is the cutting speed in m/s. In rotational systems the power is the product of the torque and the angular velocity. If the cutting force is known the power requirement can be calculated as shown in equation 2.

Where Pc is the net power requirement in kW, ae is the width of cut in mm, ap is the depth of cut in mm, Vf is the feed in mm/min, and Kc is the specific cutting force in N/mm². Although in most studies focusing on energy and power, empirical modeling has been used to analyze machining behavior, in this current research, the theoretical and experimental aspects of the phenomenon are considered. General energy modeling guidelines are still not available and the research community and industry do not have a robust method of calculating the energy. The specific energy consumption approach is supported by the mechanics of the process and offers a simple method to examine the energy behavior under the exergy framework. Nevertheless, the specific energy consumption approach only considers the energy used when the material is being removed. During the machining process, the tool engages and disengages with the work-piece and the total cycle time is not devoted to the actual material removal. Thus, modeling the air cutting time reduces the chance of over estimation of the energy demand.
2.1. Power and energy
Power can be defined as the work done in a unit of time and energy can be defined as the capacity of doing work. If we have one object having energy E, promising it will perform a work W, then energy is power multiplied by time, in Joules, which is the same unit as work units, because energy is defined by a work being done. The energy used can be obtained by monitoring the cutting power demand. For discrete time signals the electrical energy can be estimated using equation 3.

Where E is the electrical energy consumed in kJ, K is the number of data samples in one cutting pass, Pi is the ith measured real power demand in Watt, and ti is the time of each sampling point in seconds. Power consumption is measured by calculating power divided by time, using at least one complete cycle. Using power sensors, the
instantaneous voltage is multiplied by instantaneous current then accumulated and integrated over a specific time period to provide a measurement. DC power measurement is relatively simple, as the result in Watt is simply obtained by multiplying the voltage with the current. For AC power measurement, the power factor introduces complexity, since power should be multiplied by a power factor. This measurement of AC is referred to as ‘active power’ or ‘real power’. Multiplying the voltage by the current is called ‘apparent power’. Nevertheless, in an AC circuit, these quantities are continuously varying. Is because of these variations that for AC circuits the power is determined by the average power and the power factor relationship as shown in equation 4.

Where V refers to voltage in Volts, I refers to current in Amps and cosϕ refers to the power factor which is a dimensionless number. Industrial machinery operates under a three phase framework. When measuring power is common to use a three phase wire system, in which two current transformers measure phase current in any two of the three wires. Also the power meter also should be connected between two of the three power supply lines to measure voltage. In this configuration, the total power is accurately measured by the algebraic sum of the two values given by the sensors. This hold true if the system is balanced or unbalanced. If the load is unbalanced, meaning that the phase currents are different; the total power will be correct but the power factor could present error. Power meters have a special 3V3A or 3P3W wiring configuration to ensure accurate measurements on three phase three wire systems under any load.
Where E is the electrical energy consumed in kJ, K is the number of data samples in one cutting pass, Pi is the ith measured real power demand in Watt, and ti is the time of each sampling point in seconds. Power consumption is measured by calculating power divided by time, using at least one complete cycle. Using power sensors, the
instantaneous voltage is multiplied by instantaneous current then accumulated and integrated over a specific time period to provide a measurement. DC power measurement is relatively simple, as the result in Watt is simply obtained by multiplying the voltage with the current. For AC power measurement, the power factor introduces complexity, since power should be multiplied by a power factor. This measurement of AC is referred to as ‘active power’ or ‘real power’. Multiplying the voltage by the current is called ‘apparent power’. Nevertheless, in an AC circuit, these quantities are continuously varying. Is because of these variations that for AC circuits the power is determined by the average power and the power factor relationship as shown in equation 4.
Where V refers to voltage in Volts, I refers to current in Amps and cosϕ refers to the power factor which is a dimensionless number. Industrial machinery operates under a three phase framework. When measuring power is common to use a three phase wire system, in which two current transformers measure phase current in any two of the three wires. Also the power meter also should be connected between two of the three power supply lines to measure voltage. In this configuration, the total power is accurately measured by the algebraic sum of the two values given by the sensors. This hold true if the system is balanced or unbalanced. If the load is unbalanced, meaning that the phase currents are different; the total power will be correct but the power factor could present error. Power meters have a special 3V3A or 3P3W wiring configuration to ensure accurate measurements on three phase three wire systems under any load.
3. Methodology
3.1. Design of experiment
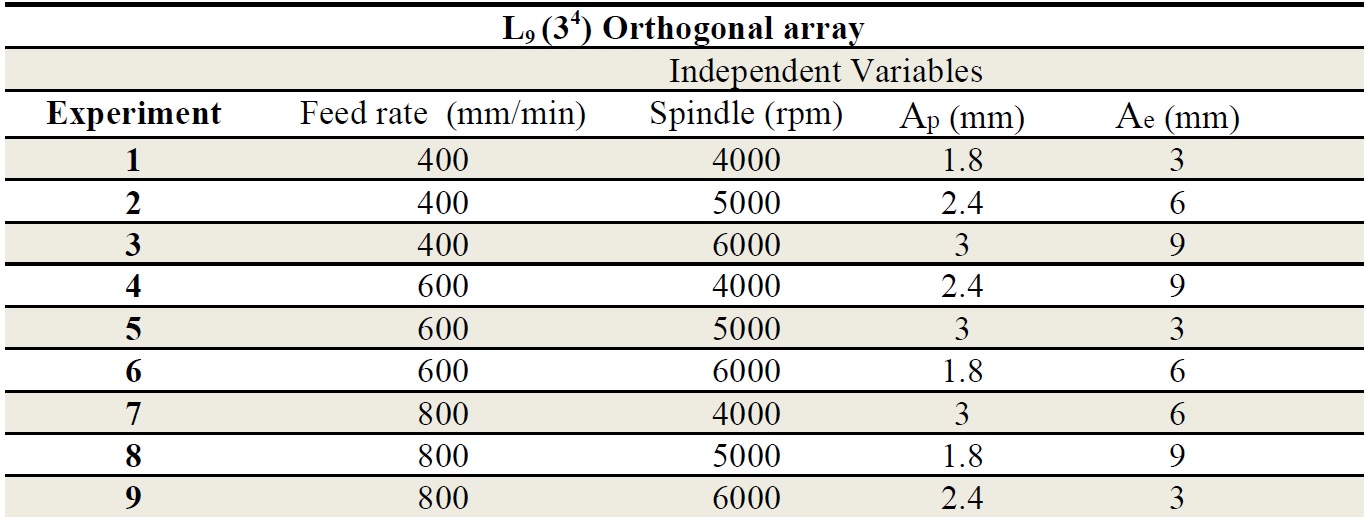
For the experimental arrangement, a Taguchi L9 orthogonal array was selected. Since the machining process involves numerous factors, a full factorial design results in a large number of experiments. To reduce the number of experiments to a practical level, a fractional array with only a small set from all the possibilities was selected. Although this method is well known, no general guidelines are available for its application or for the analysis of the results obtained by performing the experiments. In this current research the analysis is based on theoretical background and experimental observation. Taguchi L9 arrangement stipulates the way of conducting the minimal number of experiments which could give the full information of all the factors that affect the performance parameter. The advantages of the L9 orthogonal array are that it can simplify the analysis of the results, it is possible to obtain a lot of information about the main effect in relative few experimental repetitions, and it is possible to test whether non-linear terms are needed in the model. While a disadvantage of the L9 array is the limited information it can provide about the interactions; nevertheless, further analysis can be done. Taguchi L9 orthogonal array is shown in Table 1.
3.2. Selection of independent variables
Before conducting the experiment, it is important to identify those factors that have an impact on the outputs. Energy was calculated via power measurement and tool wear was periodically measured during the machining process. Also, spindle speed is a factor considered in the current analysis. For a given material, a certain set of machining conditions will have an optimum cutting speed and, from this, the spindle speed (rpm) can be calculated.
For AISI 1045, the suggested cutting velocity is 132 m/min, given a spindle speed of 3,500 rpm to maintain an optimal tool life during cutting operations. Nevertheless, in the present research, the goal is to accelerate the wear progress to reduce the time used for experimentation; a higher spindle speed was therefore used. The cutting speed is given as a set of constants that are available from machinery handbooks; however, this is always subjective to adjustment depending on the cutting conditions. Feed and spindle speeds are parameters derived from the cutting speed. Both parameters have a direct influence on the overall cutting process. An excessive spindle speed will cause premature tool wear, breakages, and cause tool chatter. Excessive feed has similar effects. Both of these parameters influence not only tool wear but also power demand, which is why spindle speed and feed rate are selected as independent variables for the analysis. Another variable that is directly linked to the plastic deformation process and the outputs under analysis is the material removal rate (MRR), which is the volume of material removed per minute. The higher the cutting parameters are, the higher the MRR. All the variables aforementioned have a relationship with power demand and tool wear. For the present analysis, the spindle speed, feed rate, depth of cut, and width of cut are selected as independent variables.
For AISI 1045, the suggested cutting velocity is 132 m/min, given a spindle speed of 3,500 rpm to maintain an optimal tool life during cutting operations. Nevertheless, in the present research, the goal is to accelerate the wear progress to reduce the time used for experimentation; a higher spindle speed was therefore used. The cutting speed is given as a set of constants that are available from machinery handbooks; however, this is always subjective to adjustment depending on the cutting conditions. Feed and spindle speeds are parameters derived from the cutting speed. Both parameters have a direct influence on the overall cutting process. An excessive spindle speed will cause premature tool wear, breakages, and cause tool chatter. Excessive feed has similar effects. Both of these parameters influence not only tool wear but also power demand, which is why spindle speed and feed rate are selected as independent variables for the analysis. Another variable that is directly linked to the plastic deformation process and the outputs under analysis is the material removal rate (MRR), which is the volume of material removed per minute. The higher the cutting parameters are, the higher the MRR. All the variables aforementioned have a relationship with power demand and tool wear. For the present analysis, the spindle speed, feed rate, depth of cut, and width of cut are selected as independent variables.
4. Experimental details
The experiments were carried out while varying the four parameters in three levels; conservative, moderate and aggressive. The levels were defined by considering the machine tool capabilities and the tool manufacturer recommendations for carbide tools. The experiment arrangement details are listed in Table 1.
Table 1. Experimental variables arrange using Taguchi´s L9 orthogonal array
In addition to continuously measuring the power as a performance parameter value, the average flank wear width and machining time were parallel measured for each experiment. Face milling operations were performed over a 100 x 100 x 50 mm AISI1045 steel work-piece. Climb milling was used along the x-axis. A 12mm diameter uncoated carbide tool with 2 flutes and a 30º helix angle was employed. Coolant fluid KS-W1 was used during the entire cutting process to match conventional manufacturing practices. The power demand was measured in a three phase setup with a Yokogawa WT330 power meter under a 3P3W wiring. The sampling frequency used for the recording of data was 10Hz. A total of 9 cutting tools were used. The wear was measured for each tool on three different points to obtain the average flank wear width. An average flank wear of 0.3mm was used as the threshold to mark the end of the useful life of the cutting tool. The experiment was performed on a 3-axis Fanuc FV400 machine center with a 5.7kW spindle power motor with maximum speed of 50,000 rpm. Spindle motor characterization was performed under no cutting load to analyze the air cutting power demand during experimentation. Knowing the power consumption during air cutting operations is useful because it helps to determine the material removal load by extracting the air cutting power demand from the overall demand. The characterization of the spindle power demand under no cutting load is shown in Fig. 1.
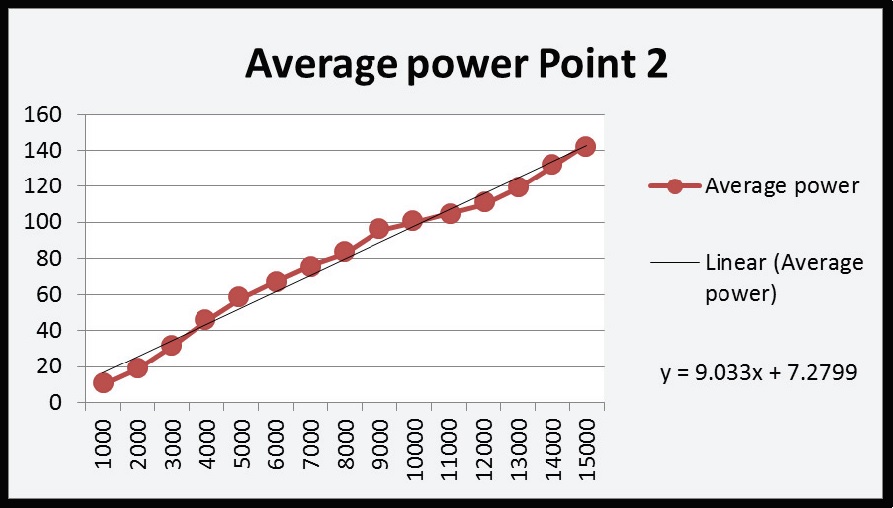
Fig. 1. Spindle power demand with no cutting load
5. Analysis and results
In the first analysis, the tool wear and power demand relationship was found for each individual tool and cutting setting. The wear measurements were taken during the first half and at the end of each complete tool path. The tool was considered to be worn out when the average flank wear width reached 0.3mm. The experiments were repeated until the wear limit was reached. The wear was measured using a video microscope system Sometech sv-35 with a 100x magnification lens. An example of wear measurement took during one of the performed experiments is shown in Fig. 2.
%20Cutting%20tool%20flank%20wear%20after%20one%20pass%3B%20(b)%20Cutting%20tool%20flank%20wear%20after%20two%20passes.jpg)
Fig. 2. (a) Cutting tool flank wear after one pass; (b) Cutting tool flank wear after two passes
The wear progression vs. time for each tool is shown in Fig. 3(a). As expected each tool reached the wear limit at different cutting times, but showed the same tendency. All cutting tools showed the typical three stages of tool wear, (rapid initial wear, uniform wear rate and accelerating wear rate), except for tool 7 which broke during the second half of the first pass. The results presented in Fig. 3(b) show a clear relationship between the increasing of the load in Watts and the increase of wear on the cutting tool over the pass of time. The same relationship was found for all nine tools. The increase in power load is clearly associated to the cutting tool deterioration, because the other factors remained constant during the cutting process in each tool path, using the same tool, the same material, and the same cutting conditions. The dullness of the cutting edge of the tool demanded more power from the spindle to perform the same amount of work.
%20Wear%20vs_%20Time%20relationship%20(b).jpg)
Fig. 3. (a) Wear vs. Time relationship. (b) Power and wear relationship over time
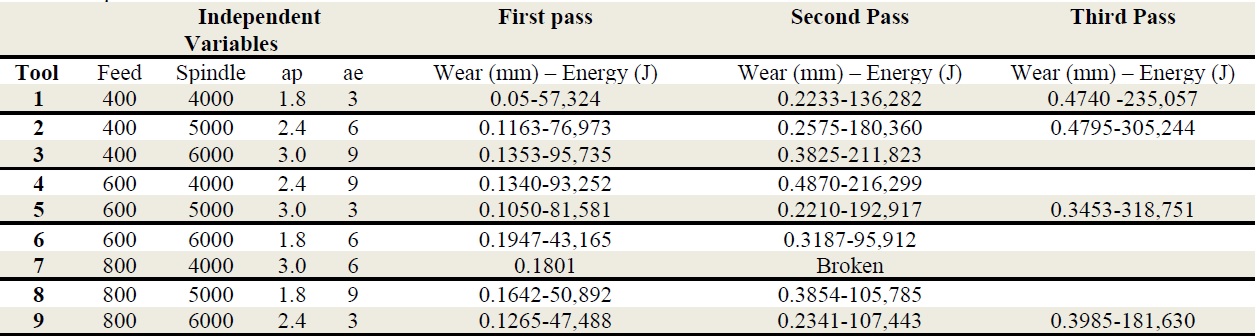
The power demand showed an incremental linear tendency as the wear increased, in all nine experiments. While this is not unexpected; it is important to understand that the power behavior due to wear progress can be expressed with a linear regression over time. Also, the wear progress tendency was similar in all nine experiments, as expected, presenting the three distinctive phases of wear. These results are useful for understanding and visualizing the approachability of tool wear estimation through spindle power analysis. Each tool presents different load values according to the cutting conditions used. However, the power and wear maintain a constant tendency over these differences. Nevertheless, the purpose of this study is to determine the possibility of an energetic limit that could help generalize the estimation of tool wear under any cutting condition while using the same cutting tool and workpiece material. The consumed cutting energy and wear progression results are shown in Table 2.
Table 2. Experimental results
The energy analysis was performed under three different premises. The total energy used during the entire tool path operation, was considered to be the combined energy used during air time and cutting time. The energy used only during the cutting operation, and considering strictly the energy used to perform the task of plastic deformation. The results are shown in Fig. 4.
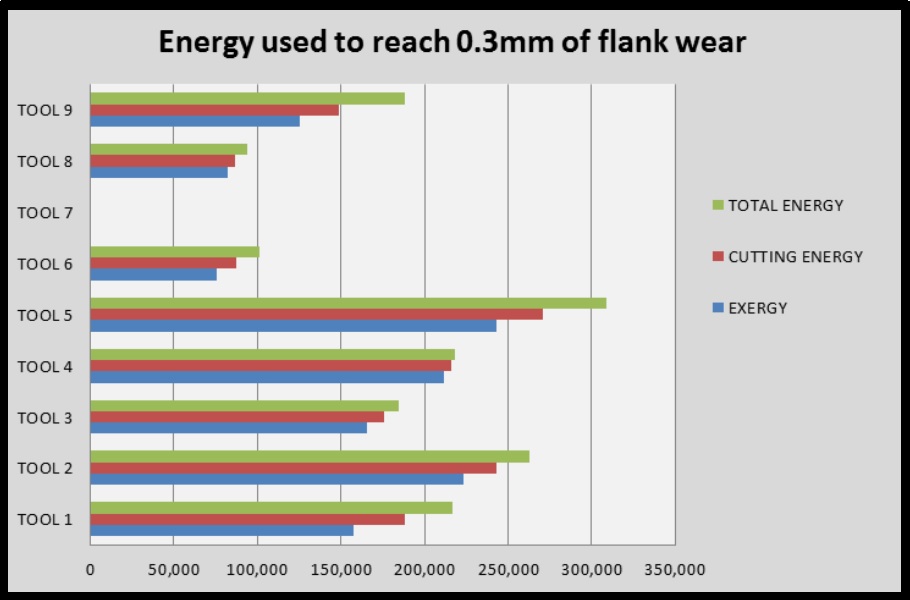
Fig. 4. Energy consumed to reach an average flank wear of 0.3mm
The energy was computed from the summation of the power data over the time period under analysis for each premise setting using equation 3. Fig. 4 shows the results for energy consumed during the machining process until the cutting tool reached the average flank wear threshold of 0.3 mm. The wear assessment was performed twice during each pass. The power data recording was paused without disturbing the information recollection, because the power measurement and cutting process time was control and well known during the whole process. Fig. 4 shows that most of the cutting tools reached the accelerating wear stage when an approximate energy of 150,000 Joules or 41.66 Wh was consumed; nevertheless, not all tools showed this behavior. To determine whether significant relationships occur among the results obtained from the experiments, a simple one way Poisson analysis of means was performed using Minitab 16. For the first premise, where the total energy used during cutting and non-cutting time is considered, the analysis of means showed acceptable energy/wear relationships only for tools 1, 3, 4 and 9; indicating that only those tools reached the tool life threshold consuming a similar amount of energy regardless of the cutting conditions. For the second premise, where only the energy used during cutting operations is considered, the analysis of means showed even less relational inference between the experimental results, presenting only a clear energy/wear relationship for tools 1, 3, and 9. Under the last premise, in which the analysis focused only on the energy necessary to perform the plastic deformation, similar results to those of as the previous premise were obtained. The experiment was designed to use different cutting conditions, focusing on different machining times and different material removal rates with the purpose of determining a general relationship. It is well known that energy is highly dependent on MRR and machining time; and that both of these factors are very closely interrelated. Maintaining similar MRR and machining times would only result in limited relationships between factors in the process and would not be useful in the search for a wider perspective. The experimental results showed that it is not possible to relate the energy transferred from the spindle motor to the cutting tool wear progress. Nevertheless, the experiments showed that is possible to obtain a clear relationship between spindle power and tool wear rate. If the goal is to generate a platform to detect or estimate tool wear, the most effective, direct and economical approach is to measure the spindle load during cutting operations. Even though a significant amount of data would be required to create such a platform, the acquisition and analysis is easily accessible.
6. Conclusions
The energy results were analyzed under three different premises; using only the energy strictly involved in material removal operations, using the energy involved in the cutting process and spindle rotation, and using the total energy involved in cutting and non-cutting operations. Under these three premises, the experimental results failed to demonstrate the capability for the same cutting tool to deliver a constant amount of energy before reaching their tool wear limit under different cutting conditions. Although some tools reached their wear limit while consuming the same amount of energy, the experimental results are not conclusive enough to assure that there is a specific energetic limit that could be applied to a wider range of cutting conditions. Nevertheless, the results showed that spindle power and tool wear progression maintain the same trend, only varying in magnitude depending on the cutting conditions. This result is extremely important for tool wear monitoring, because the collection of power trends could be recorded, analyzed and used as inputs to train a model that could realistically indicate when it is appropriate to replace the cutting tool. Energy exhibits a highly dynamic behavior; possibly due to the power losses of the spindle motor under different cutting conditions and cutting tool temperature; factors which were disregarded in the present analysis. The experiments showed that the spindle motor power demand is a reliable source for tool wear analysis. The spindle motor power demand seems to represent a very straight forward option for estimating tool wear, since the only obstacle is the amount of data that should be collected to create a reliable model. The results indicate that the power demand produced by tool deterioration has an incremental linear tendency. This incremental tendency presents specific rates of increase depending on the particular cutting conditions.