Protocol for end mill wear measurement in micro-milling
2020-05-11
Highlights
•New protocol for end mill wear measure in micro-milling has been developed.
•Protocol considers wear of flank and rake face of end mill to provide a complete picture of end mill wear.
•End mills have been measured successfully using protocol, with typical end mill-wear curves produced.
•New protocol overcomes limitations when assessing micro-end mills with standard micro protocols.
Abstract
Micro-milling yields small accurate parts quickly for electromechanical, aerospace, and medical applications. Due to their small size, micro-end mills wear quickly and unpredictably therefore end mill wear is difficult to measure and is poorly understood, leading to excessive end mill changes and reduced productivity. This paper, therefore, proposes a new protocol for micro-end mill wear measurement to overcome these problems. A strict set of criteria as found in an ISO standard is impractical for micro-milling research. The method herein allows comparisons to be made across materials and situations and detailed are certain criteria that must be fulfilled to achieve this. To evaluate the protocol micro-end mills were used to machine three materials: brass, titanium and Hastelloy; and wear curves produced. Using the described protocol, these wear curves can be analysed similarly to those for larger end mills. Profile analysis of the slots machined provides valuable information about end mill wear where direct measurement is impossible. This new protocol presents a novel method for analysing and reporting end mill wear for micro-end-mills, allowing them to be compared under different machining conditions and/or milling different materials, something not afforded by existing machining standards. The information can then be transferred to industrial applications, extending end mill life and improving process efficiency.
Cutting terminology
Xcomp Total sliding distance
Cing Number of incomplete circles
Ccomp Number of complete circles
Nrev Number of revolutions
Dcap Engage tool diameter
Xi Sliding distance of incomplete circle
Fcut Cutting frequency
N Spindle speed
Zc Number of teeth
Fc Cutting force
T Cutting time
Fz Feed rate
Vc Cutting speed
Cing Number of incomplete circles
Ccomp Number of complete circles
Nrev Number of revolutions
Dcap Engage tool diameter
Xi Sliding distance of incomplete circle
Fcut Cutting frequency
N Spindle speed
Zc Number of teeth
Fc Cutting force
T Cutting time
Fz Feed rate
Vc Cutting speed
1. Introduction
With increasing miniaturisation of engineered devices, micro-milling has emerged as one of the most popular processes for manufacturing small components because it is capable of rapidly producing high integrity parts. It is widely used in the medical and aerospace sectors, and in fields where miniaturised machine elements are commonplace such as watchmaking; optics and electronics; and micro-mould manufacturing. Some of these areas only require softer materials such as copper and brass alloys to be machined. However, the medical and aerospace industries make use of materials such as titanium and high-performance superalloys.
These are typically difficult-to-machine using macro-scale end mills, but present further complexity in micro-milling as burring and crystal irregularities lead to fracture of the end mills. Wear studies of micro end mills are essential since it is very important to achieve a high-quality surface finish in many of these industries, either for aesthetic purposes or because the function of the components is impaired where surface finish is poor (such as where components have moving parts).
Furthermore, worn end mills cause increased burring, which causes dramatic increases in cutting forces. It is also very difficult to remove burrs from micro components using conventional methods. The development of end mill wear curves for different micro-milling situations enables the prediction of end mill life, thus allowing the end mill to be used for the maximum possible length of time while maintaining a good surface finish. This maximises productivity and minimises costs. Historically, studies on micro end mill wear have plotted end mill wear against cutting distance or cutting time. Measurement of cutting distance moved by the end mill relative to the workpiece or cutting time (i.e. when the end mill is engaged) does not consider the different feed rates and speeds used for different materials, cannot be used to compare end mill life of micro-end mills between materials. As a result, the sliding distance for each tooth is used to measure end mill wear against (as formally described in Section 3 of this paper).
Furthermore, micro end mill wear studies are inconsistent across the literature reviewed since different metrics are used to measure the wear of the end mill: edge radius, flank wear and end mill radius reduction being the most popular. To better standardise micro end mill wear studies and understand the wear of micro end mills, a protocol for measuring micro end mills has been specified herein. The aim of the work presented here is therefore to propose a protocol for the measurement the wear of end mills used in micro-milling that overcomes the issues of using existing methods that were primarily developed for macro-scale end mills.
2. Background and state-of-the-art
2.1. Micro-milling
Micro-machining can be defined as the use of mechanical end mills which have geometrically defined cutting edges to manufacture features which have dimensions in the order of micrometers. Micro-milling can be considered a subsection of micro-machining and, as with all micro-machining, produces very different results to conventional milling. There are several reasons for this, the first being that, relatively speaking, end mills can appear blunt from the point of view of the workpiece material. If the depth of cut is much smaller than the cutting-edge radius, the end mill is likely to rub along the surface of the workpiece and burnish it, rather than cutting it.Another problem is that due to their diameter, even fine-grained micro-milling cutters generally have low stiffness and poor resistance to fracture and so it can be difficult to study them for extended periods of time as the end mills can fracture before significant wear has taken place (and even become lost). Finally, although on a macro-scale a polycrystalline structure appears homogeneous, at the micro-scale grain sizes are relatively large when compared to the size of the end mill and thus machining forces can be hugely variable. These effects combine to create an effect known as the size effect. This is defined as “the phenomenon whereby the reduction of the undeformed chip thickness to levels below the cutting edge radius, or grain size of the workpiece material begins to influence workpiece material deformation mechanisms, chip formation and flow”, that is to say that conventional macro-mechanics cannot be used to describe the system as simply reducing the scale does not produce a representative model.
2.2. Wear and wear measurement of micro-milling end mills
Typically, end mill wear studies in milling follow the protocols laid out in standards such as ISO8688-1 and ISO8688-2. These determine what parameters, materials and sizes of cut should be used and are generally used as benchmarking tests for the quality of end mills. However, for micro-milling the ISO standards are not appropriate and thus adapted tests must be carried out. There are some components which can be applied from the ISO standards. One such component is the terminology used to describe end mill wear: this is useful as the wear of micro-end mills can then be compared with that of macro end mills.These ISO standards also identify critical wear (i.e. the maximum acceptable wear of the end mill). This is the point at which end mill wear starts to increase rapidly towards the end of the end mill life.
The wear of micro-end mills is often much more poorly-described than that for macro-end mills, and end mill wear curves described using measurements of cutting edge radius and end mill diameter do not typically yield traditional wear curves. Bahrudin et al. investigated flank wear behaviour of micro-milling end mills of 0.5–1.5 mm for titanium and H13 end mill steel using a scanning electron microscope (SEM) against cutting time. Although they were able to produce wear curves for some of the end mills investigated, this was not consistent across the entire range of end mills and wear was only measured for one tooth of each end mill. Since even a very small run-out has a very significant effect on tooth engagement for micro-end mills, it is important to consider the wear on both teeth. They observed that surface finish was inconsistent over cutting time and inferred that this indicated an inconsistency in cutting forces. They did not, however, measure the cutting forces directly.
Based on the issues with machining on a micro-scale especially regarding wear and fracture of end mills, numerous studies have been carried out to investigate the effects of different parameters on micro end mill wear. Increased cutting velocity increases end mill wear which is similar to conventional machining. Moderate feed rates typically result in more stable forces which reduces end mill wear (as opposed to very low or high feed rates), but only provided that they are not high enough to cause fracture. Since the edge radius of micro-end mills is comparable with the grain size of materials that are being machined, microstructure is important and materials with a higher elasticity result in more ploughing (rather than shearing).
Chip formation differs from the conventional case: for a small feed per tooth, a chip is not seen with each pass of the tooth, and instead burnishing or rubbing occurs. Premature end mill failure is a common problem in micro-machining and this presents difficulties when measuring wear: whereas in conventional machining the end mill fails as cutting edges break, with micro-end mills the entire shaft often fractures a result of excessive stress induced by the particular usage of the end mill (for example, dulled or damaged cutting edges which cause forces to be higher than expected).
It is useful to consider cutting forces to better understand the point at which critical wear starts to take place. Particularly, total cutting force variation (magnitude) as the end mill wears has not yet been considered in terms of end mill wear studies. This is important because a high force magnitude indicates excessive vibrations which lead to an increased rate of end mill wear. The first stages of the work carried out herein (described in Section 2.2) investigated the cutting forces as the end mill wore, since in macro machining it is expected that cutting forces increase as end mill wear increases.
To date, the most detailed curve produced using micro-end mills used the surface finish of end mills as a wear metric, citing that micro-end mill wear is too difficult to measure. The problem with this metric is that surface roughness is dependent on the sharpness of the end mill, and whether rubbing or burnishing occurs. This means that if edge fractures occur at certain stages, or material builds up on the end mill, the wear mechanisms taking place (e.g. degree of rubbing or shearing) can change. Thus, surface finish cannot be equated to end mill wear.
Ucun et al. observed that the cutting edge radius does not give an adequate measure of end mill wear, as over the lifetime of the micro-end mill a new cutting edge is gradually formed, so that although cutting edge radius initially increases with end mill radius decrease, it later decreases again. They measured the diameter reduction for various end mills under various cutting conditions but did not plot wear curves. The same method was used to measure end mill wear on-line using a variety of sensors by Malekian et al. where similarly edge radius failed to describe the primary locations of wear for the end mill, although it was a useful metric in terms of whether shearing or elastic deformation of the material occurs. Measuring edge radius often shows increased wear with cutting distance but does not show similarities to conventional end mill wear curves.
Flank wear, another possible metric for quantifying end mill wear, was use by Aramcharoen et al. but as the primary aim of the study was to evaluate different coatings, no wear curve was produced and thus the usefulness of this measure in producing wear curves could not be assessed. Flank wear was also used as a measure of wear by Ding et al., along with edge radius, for micro-mills of 0.1 mm in diameter, but no clear wear curve was seen (although wear clearly increased with cutting time), perhaps due to the extremely small size of the end mills and a limited number of measurements. Elkaseer et al. modelled the effects of steel microstructure on end mill wear but did not investigate the evolution of wear for the end mills.
A more efficient approach was investigated by Filiz et al. whereby a reduction of channel width as a measurement of cutting edge radius was used to investigate machinability of copper, which did not require the end mills to be removed for measurement during machining. This is similar to measuring end mill radius and does not give information about individual teeth or uneven tooth wear. However, a similar process is applicable to micro-milling, in the sense that channel profile can give an idea of end mill wear and, providing an appropriate level of data is held relating end mill wear to channel profile, can allow end mills to be measured without removing them from the machine.
2.2.1. A need for a common method
It has been noted by a number of authors that there is, compared with macro-milling, no established protocol for measurement of end mills. This leads to a lack of existing data to compare studies with which slows down the process of applying end mills in an industrial context. As previously described, flank wear and diameter are often used, but not always. Wang et al. investigated cutting performance of cermet and coated WC end-mills in the machining of TC4 alloy, with end mill wear being one of the metrics to assess the process. They stated that because “in micro-milling, there are no unified methods to appraise end mill wear”, width of micro-grooves was used as a measure of end mill wear. This is clearly incomparable with measurement of the actual end mill, and such a study could not be related to one that measures the flank and diameter of the end mill. Clearly, the only way to achieve unification of these studies and compare them or combine them to benefit industry, is to define a standard protocol.
2.3. Preliminary study
Initial trials were carried out on Brass (CuZn37), which plotted end mill wear against cutting distance for AlTiN coated carbide end mills. The results (Fig. 1) showed that end mill wear can be measured successfully using a SEM.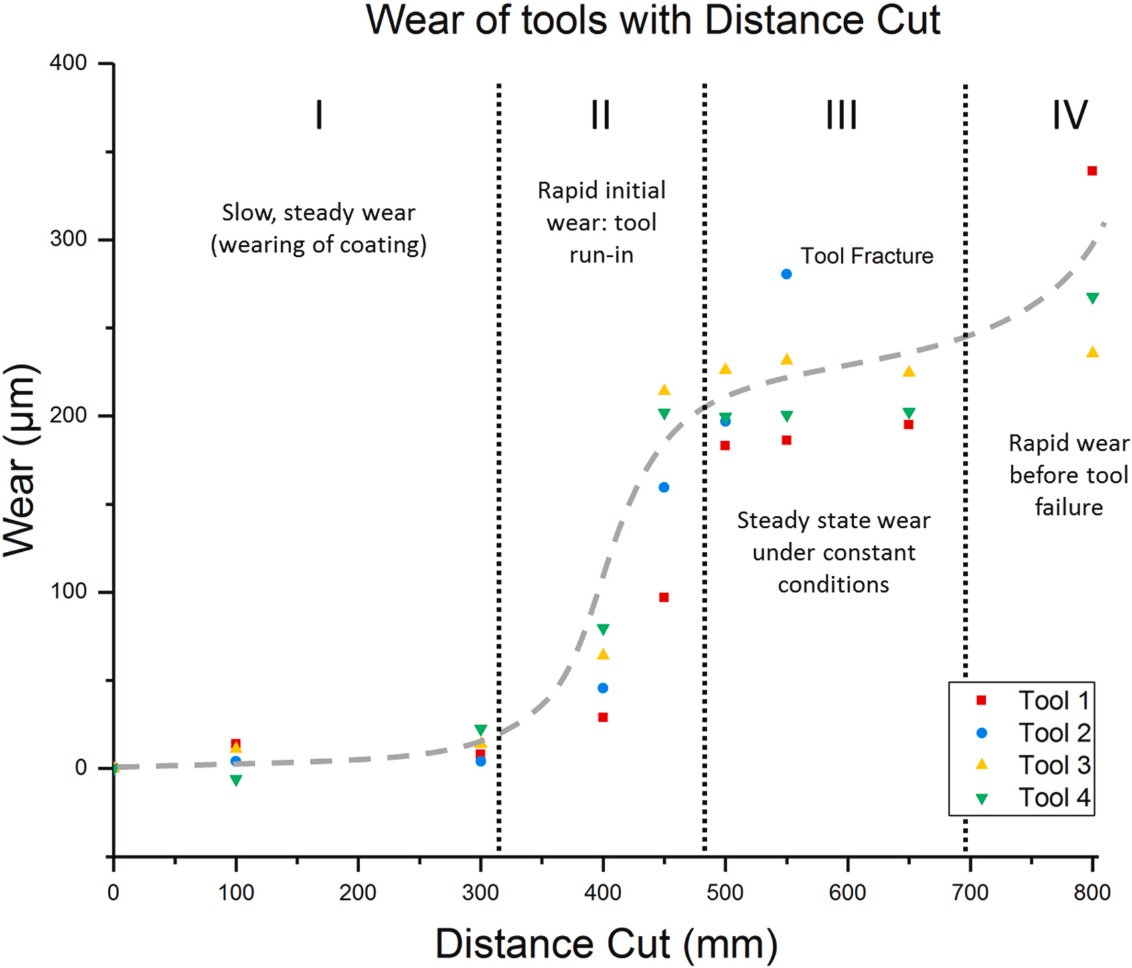
Fig. 1. Wear of 0.5 mm micro-end-mills cutting CuZn38. The wear is given in terms of total reduction in diameter.
The wear for the four end mills can be examined in terms of zones. Initially, in Zone I (up to a cutting distance of 300 mm), very little wear was observed, and it is likely that this is the distance at which the AlTiN coating was removed. The coating, which is widely-used in high-performance applications such as micro-milling, and survived well before this point because brass is a very soft, easy-to-machine material that is well-suited to AlTiN coatings. After this point, the end mill wear shows the characteristic wear curve typically seen for macro-end mills. This is not often seen in previous micro-mill wear studies due to under-sampling of the end mill wear or inadequate measuring techniques. In Zone II, rapid wear of the end mills was seen as the cutting edge was initially blunted from a very sharp point. During section III a relatively slow, steady increase in wear was seen. Finally, Zone IV showed an increase in wear as the end mills became severely worn. Fracture of end mills occurred in this stage (with the exception of one end mill, which broke in Zone III). Using a SEM with the end mill in the two orientations shown in Fig. 2, it is possible to measure the end mill wear using the protocol detailed in Section 3 (where the terminology used relates to the ISO standards). In reality, often more than one type of wear is seen (see Fig. 3). It is important to note that these two angles are the minimum requirement to identify all the wear types described.
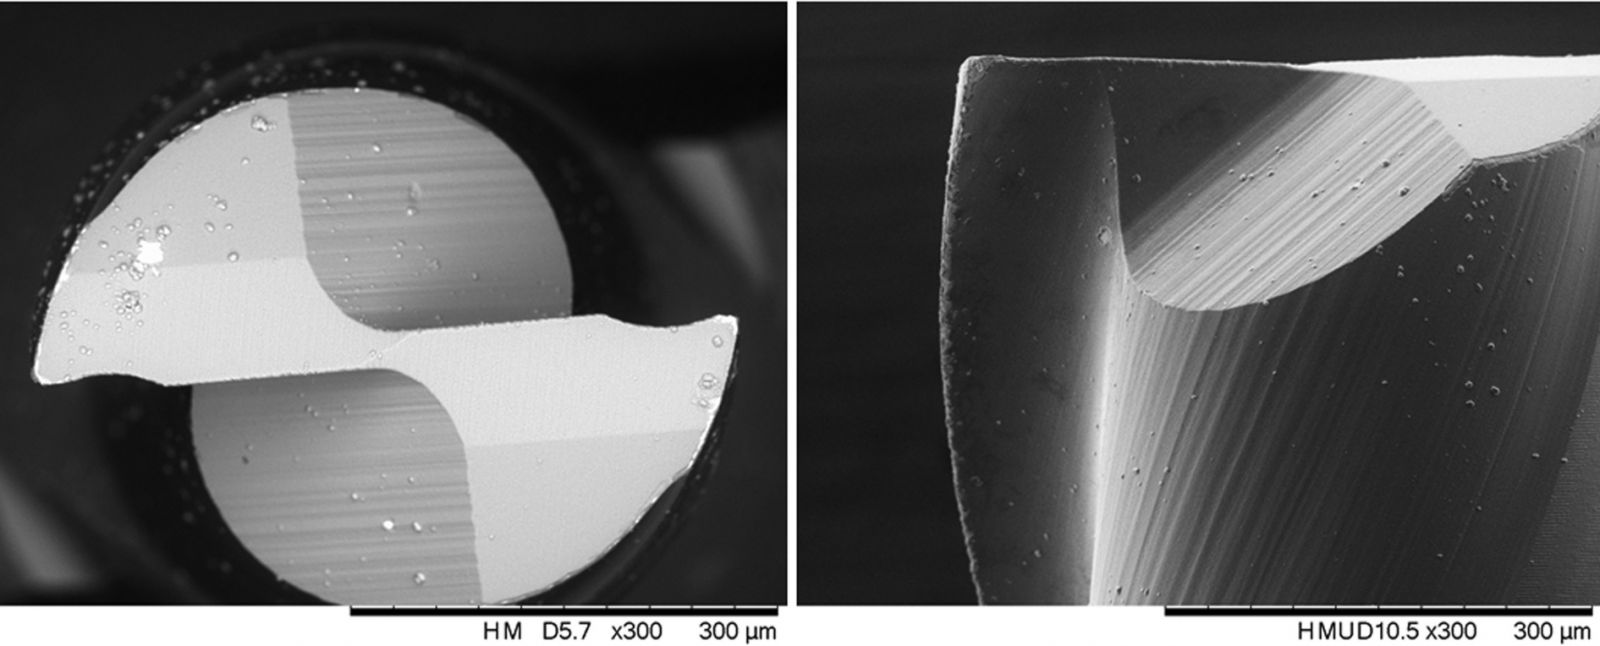
Fig. 2. The two orientations in which tools were measured.
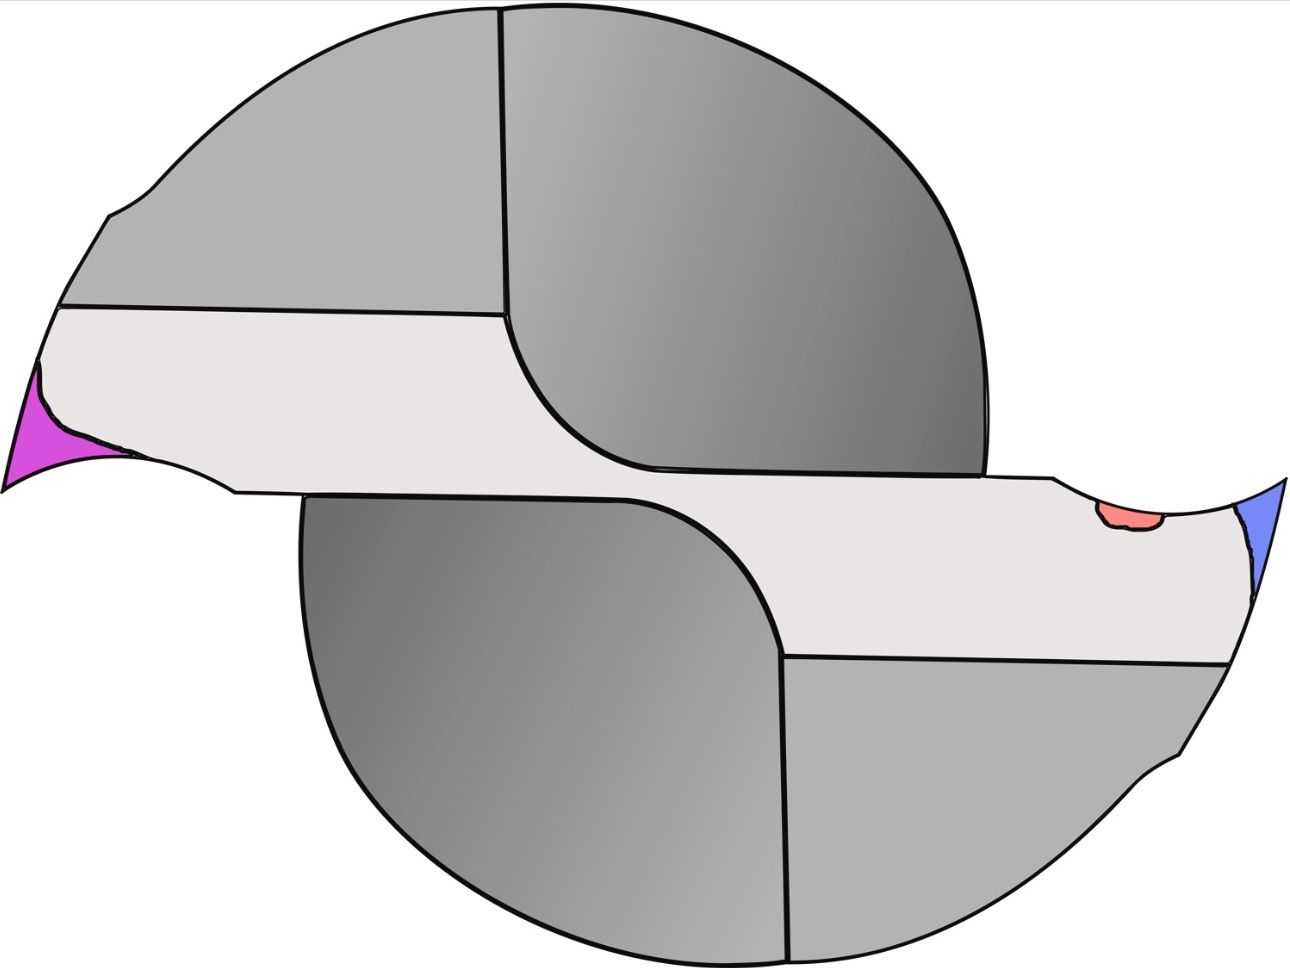
Fig. 3. An example of multiple types of wear occurring - here, VB and KT2 can be seen in purple, while CH and KT1 are seen in red, and VB is seen in blue. (For interpretation of the references to color in this figure legend, the reader is referred to the web version of this article).
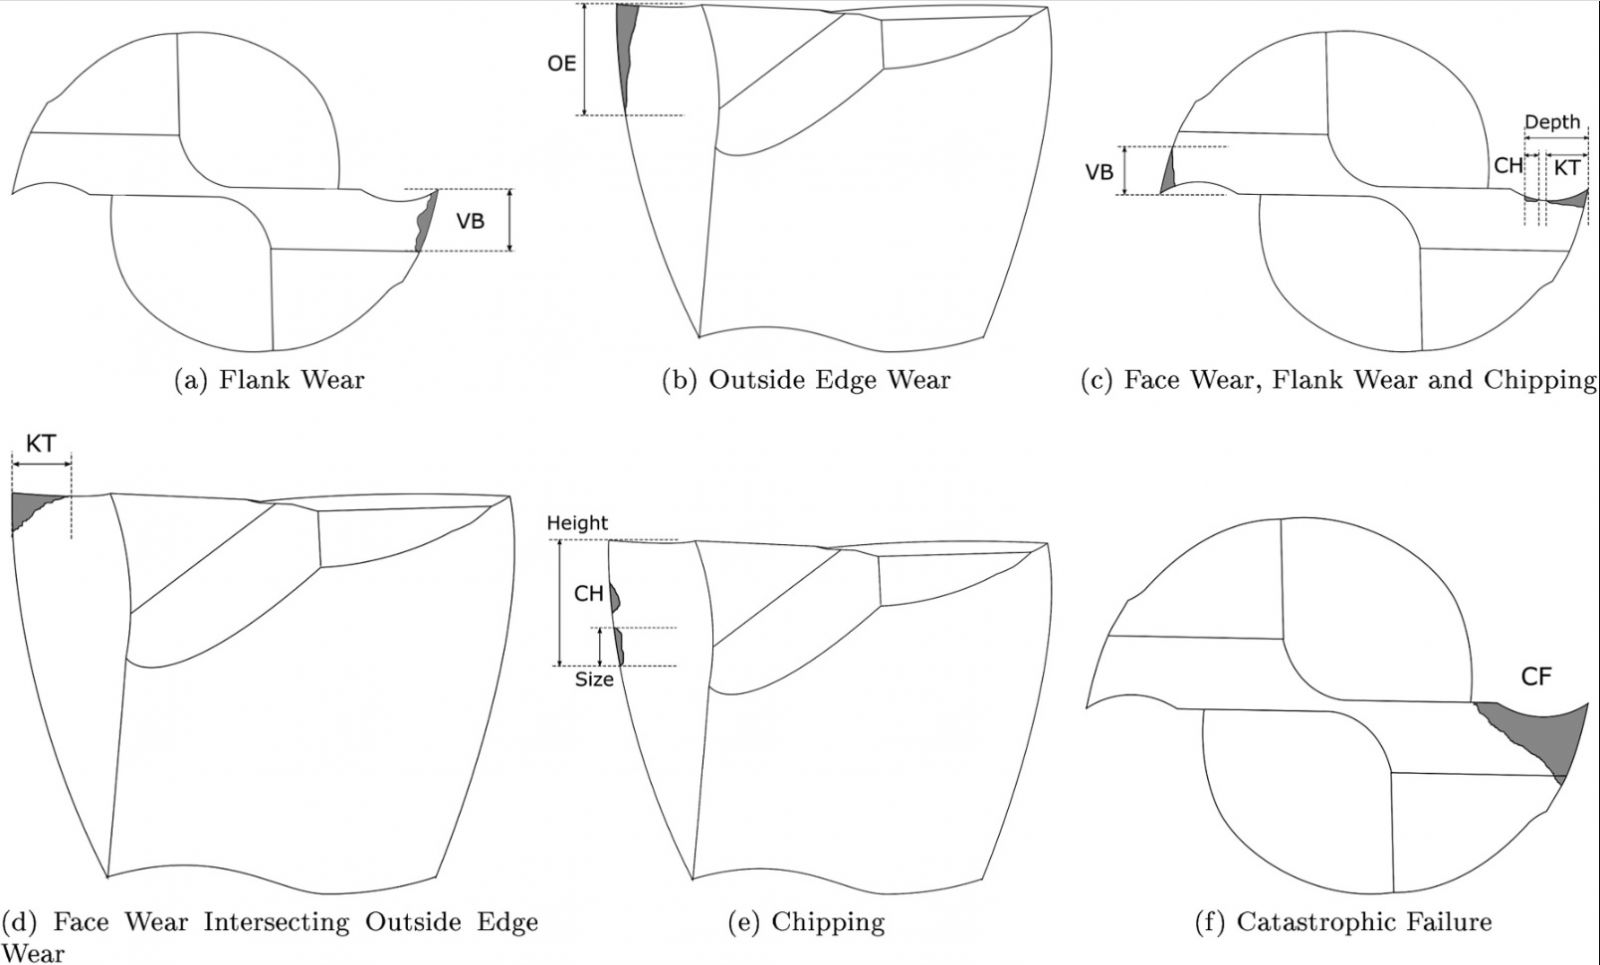
Fig. 4. Types of Wear - graphical representation.
The preliminary study and the difficulties encountered when measuring micro end mill wear using only outside diameter highlighted the need to achieve a standardised protocol that would provide more information than simply current end mill radius.
3. Development of protocol
3.1. Purpose
In the light of the lack of work on standardising end mill wear studies for micro-milling, it was decided that a protocol for measuring end mills should be established to aid future studies of the wear progression and underlying mechanisms in micro-milling in both conventional engineering materials such as steel, and in aerospace metals (such as titanium and nickel alloys). It is clear both from preliminary experimentation by the authors and a review of literature that the wear of micro end mills can be directly observed using optical methods (SEM) to give a classical end mill wear curve. However, aside from inconsistencies between studies and the need for standardisation if comparison between studies is to take place, there are some serious problems with methods such as measurement of end mill radius, not least the fact that it does not consider uneven wear of the teeth: for example, were catastrophic wear to take place on one tooth while the other tooth remained unworn, the measurement would be the same as if the two teeth were worn moderately (see Fig. 3). As a result of the preliminary work described in Section 2.3, it was established that a more precise measurement method for the wear of micro-end mills is required to be developed and tested, with the intention that machining parameters and materials to cut should be flexible, but standard reporting methods should be used to allow comparison between studies.
3.2. Definitions
Certain parameters must be defined when measuring wear on micro-end mills; including cutting edge radius, end mill radius, and surface finish of workpiece, and similarly a qualitative indication of the wear mechanism(s). Cutting edge radius is defined as the radius seen on the cutting edge of the end mill rake face. The end mill radius is defined as half of the working diameter of the end mill (for a 0.5 mm end mill, this is 0.25 mm). The surface finish of the workpiece is defined as the measured Ra value and the surface texture as the measured Sa value. Types of end mill wear are based on ISO8688 and adapted for small end mills. These are categorised (Table 1) as Flank Wear (VB), Face Wear (KT), Outside Edge Wear (OE) Chipping (CH) and Catastrophic Failure (CF). By measuring end mills in relation to these types of wear, direct comparison between studies can be made (Table 2).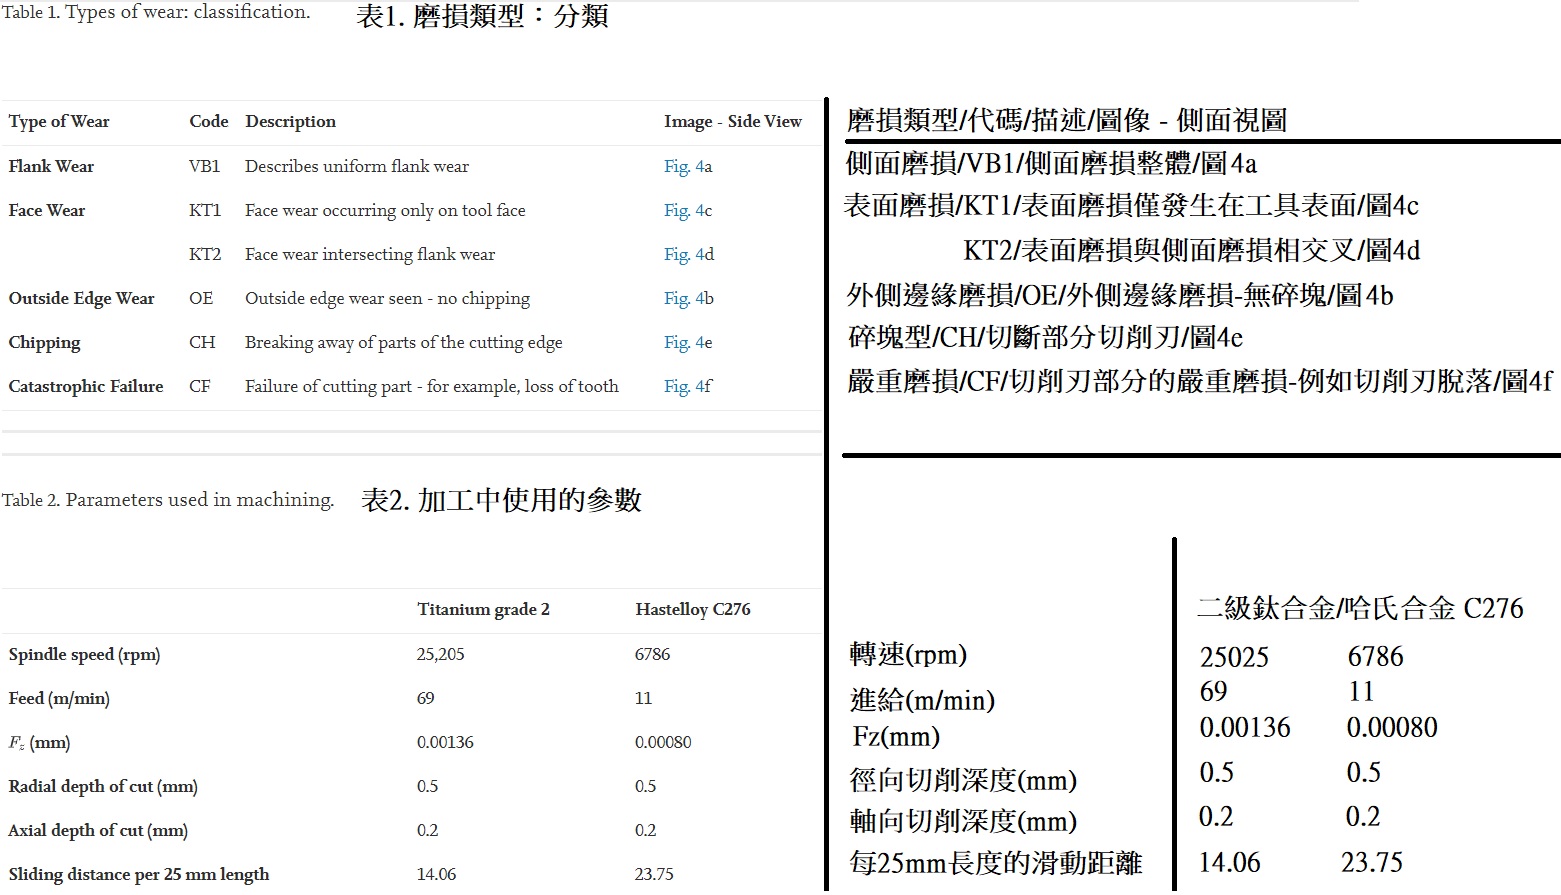
3.3. Materials: using sliding distance as a measure of distance cut
In the literature reviewed in Section 2, end mill wear for micro-end mills has been expressed in literature in terms cutting distance or material removal rate. While this method is useful for describing the useful life of a end mill in a given material, it is very hard to compare wear of end mills between materials because the difference in cutting feed and speed results in dramatically different sliding distances for different materials. The sliding distance of the teeth was calculated using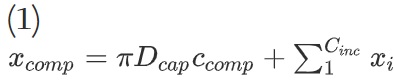
where Cinc is the number of incomplete circles, calculated by
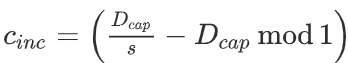
Comp is the number of complete circles, calculated by Ccomp = nrev - cinc, Dcap is engaged end mill diameter, and
is the sum of the sliding distances for all the incomplete circles (Fig. 5). This method is more useful in a tribological sense, but also allows end mill wear for different materials to be compared even in the face of different cutting conditions. The value of Xcomp was calculated using a Matlab program which established
.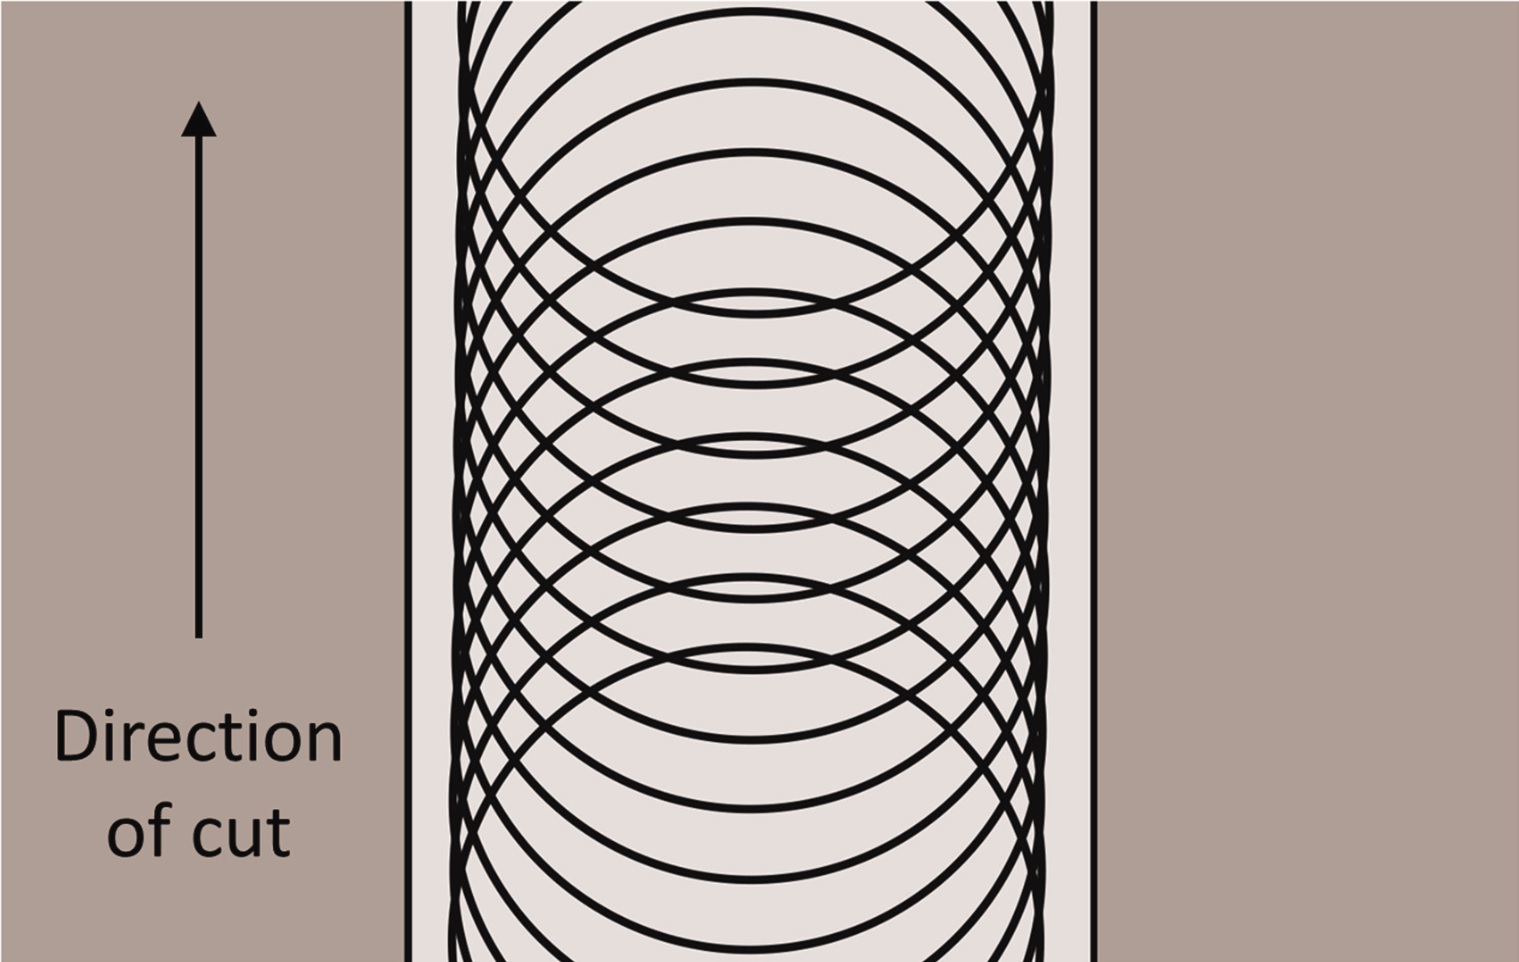
Fig. 5. Path taken by milling cutter with end mill starting and finishing clear of the work piece.
Use of sliding distance allows a more consistent metric to measure end mill wear against than cutting distance or cutting time, as the amount of work carried out on the end mill depends on spindle speed and feed rate. Conversion factors can be used to relate these sliding distances to either cutting distance or number of cuts given a known spindle speed and feed rate, allowing end mill wear to be predicted under differing conditions.
3.4. End mill and workpiece preparation
End mills should be inspected before wear testing takes place to ensure minimum quality standards are met. For uncoated end mills, an as received edge radius of < 0.1 μ m can reasonably be expected, while for coated end mills it may be up to 0.2 μ m. Grain size of the workpiece must be considered in terms of end mill size, and these taken into account. No specification is given, but when comparing workpieces, the grain direction should be the same for each workpiece, and care should be taken where grain sizes are in the order of 0.1D, where D is end mill diameter, to ensure that workpiece grain sizes do not differ by more than 0.02D. In addition, the following criteria regarding depth of cut and unit removal should be met. Unit Removal is defined by Taniguchi to be the amount of material removed per cut, having any of one, two or three dimensions. These two criteria combine such that:• edge radius < depth of cut and
• edge radius < unit removal × 10
All workpieces should be faced off to ensure flatness perpendicular to the end mill and fixed to the machine bed such that the surface is normal to the z-axis. Typically, flood or mist lubricant should be used to control machining temperatures, where the pressure of this on the workpiece is monitored using a micro dynamometer or 3-component force link and taken into account when considering machining forces. Coolant method should be consistent across comparative studies.
3.5. Measurement of end mill
The micro end mills should be measured both prior to testing and during testing. The basic equipment required for testing is as follows:
• Scanning electron microscope with both scattered and backscattered electron functionality.
• Optical profilometer (e.g. focus variation or white light interferometer).
• Ultrasound bath.
• Acetone.
• A compressed air source.
• A force cell for measuring lubricant pressure on workpiece.
During cutting, cutting forces should be measured to determine lubricant pressure as well as cutting forces. End mills should be removed at a pre-determined interval for measurement using an SEM. Before measuring using SEM, end mills should be cleaned using acetone in an ultrasound bath and then dried using compressed air. End mills should be measured in two orientations, as shown in Fig. 2 and it is possible to measure the end mill wear using the protocol detailed in Table 1 (where the terminology used relates to the ISO standards). Often more than one type of wear is seen (see Fig. 3). It is important to note that these two angles are the minimum requirement to identify all the wear types defined in the table. All wear measurements are expressed in terms of μm.
3.6. Measurement of slot profiles
The machined slots may be measured using one of two methods: either an image of the cross-section of the material should be taken, as in Fig. 1; or a profilometer can be used to measure the slot profiles (Fig. 2). If the latter is used, it is important to ensure that de-burring takes place as this will give inaccurate results. The de-burring must be carried out carefully and in such a way that there will be no further wear of the slots.Once measured, slot profiles can be described as seen in Fig. 3, where Wbt and Dt are the theoretical width and depth of slot respectively, and Wb and Da are the base width and actual depth. The depth of the slot may be a less reliable method of measuring flank wear than the width for measuring rake face wear, if the workpiece has not been faced off to a suitable flatness.
3.7. Criteria for end mill life
Worn end mills should be measured according to Section 3.5. Face wear of 0.2D should not be exceeded as this is considered catastrophic failure of the end mill. For the purpose of wear measurement, measurement of face wears up to 0.2D will provide data into Zone III of the end mill which exceeds practical use and allows the end mill life criterion to be established.
3.8. Test procedure
For wear testing, slots should be machined to a depth as specified in the data provided by the end milling supplier or manufacturer. The slot should begin outside the workpiece and run in the y-direction of cut.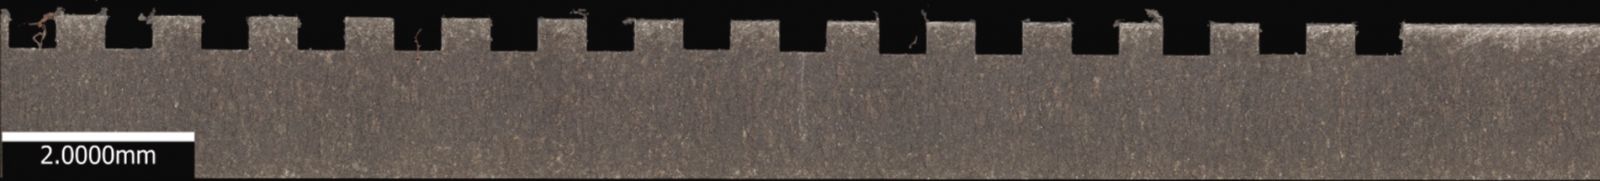
Fig. 6. Image of cross section.
3.8.1. Machine end mill requirements
The machine end mill should be a specialist micro-machining centre capable of reaching spindle speeds of 50,000 rpm or higher (Fig. 7).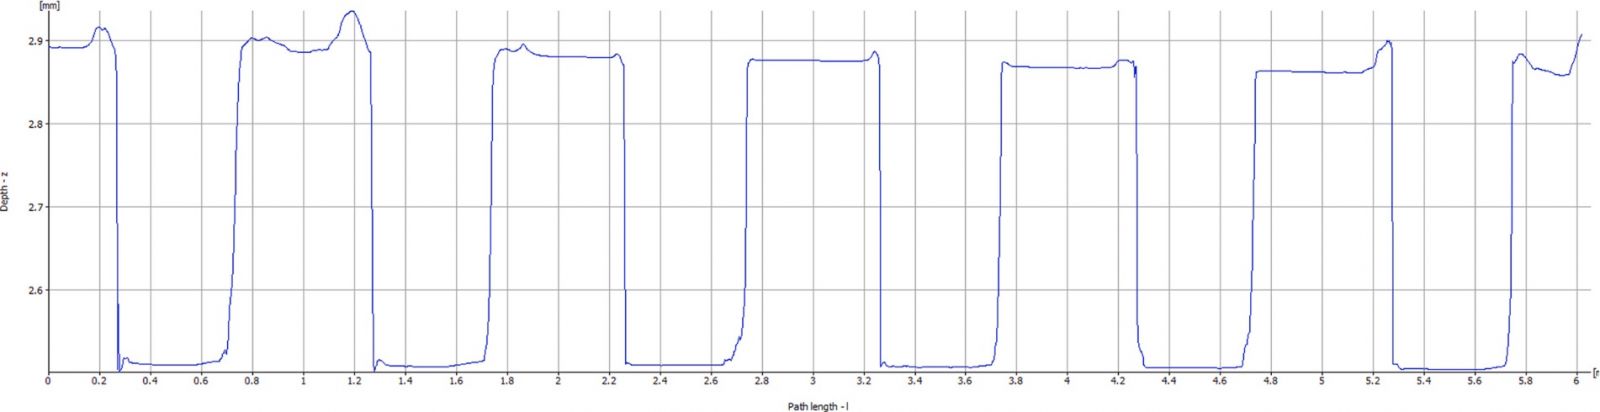
Fig. 7. Cross-section measured using profilometer.
3.8.2. Measurement of forces
In micro-milling applications, very small run-out leads to significant errors in engagement of teeth and uneven tooth wear. It is therefore always useful to examine the force signature for each tooth engagement to establish whether tooth engagement is equal (Fig. 8).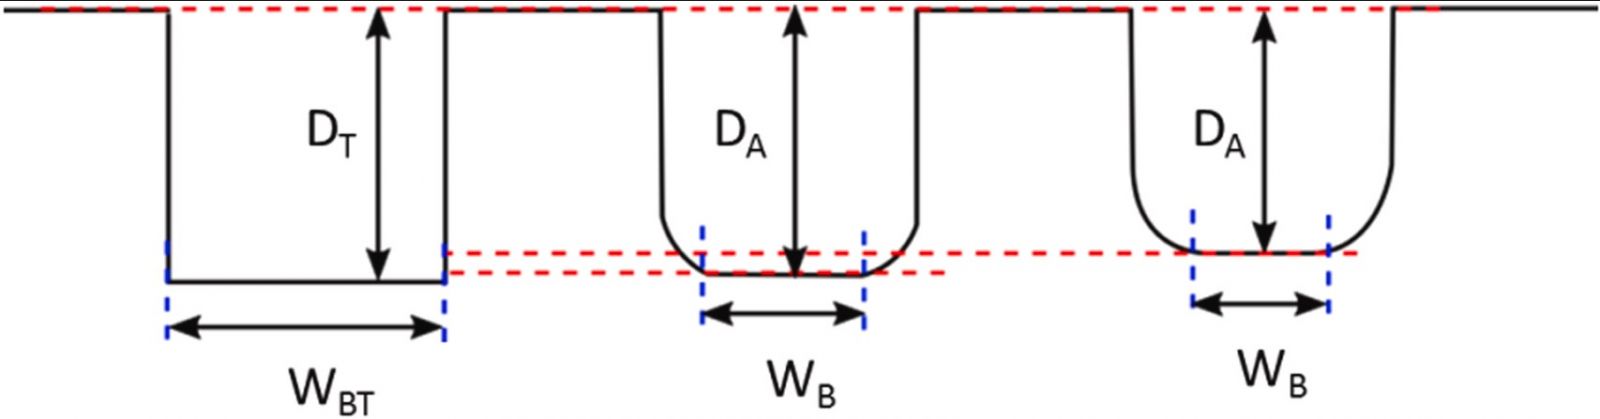
Fig. 8. Slot profile measurement parameters.
As the forces measured in micro-milling are very small, it is useful to analyse forces using two different methods: measurement of the average cutting force and measurement of the amplitude of cutting force. The former is used to give a general picture of the cutting forces in the feed direction (denoted by Y in Fig. 9), and simply averages (mean) the value of the signal over the specified cutting time. The latter is slightly more complex because it considers the range of the cutting forces experienced over the specified time. To do this accurately, the difference in engagement of the teeth must be accounted for by plotting the second term of the Fourier Transform. First the second fourier coefficient, must be calculated as shown in Eq. (2), where fcut is the cutting frequency which is found by fcut=n/60 x Zc where n is the spindle speed in rev/min and Zc is number of cutting teeth.
Fc is the cutting force, t is the cutting time and x is the number of data points. Using the second coefficient, the real part of the second Fourier term can then be plotted against time, using Eq. (3).
Fig. 9. Forces exerted on the micro end mill.
3.9. Reporting of results
Where end mill wear evolution is plotted, wear should be reported in absolute terms relative to the original size of the end mill (i.e. in μ m). Sliding distance should be used for the x-axis, with a second axis being used as a conversion factor to cutting distance where required. An example of this is given in Fig. 10. End mill wear should be identified as being in one of three zones:
I. Rapid initial wear
II. Steady state wear
III. Rapid wear before failure
The end mill-life criterion can then be identified as the intersection between phases II and III.
Fig. 10. An example of the way in which results should be reported.
4. Validation tests
4.1. Materials and methods
Once an acceptable wear testing protocol had been established, machining trials were designed to test the pertinence and consistency of the method. Three mechanically very different matierials were used: brass (CuZn37), titanium grade 2 and Hastelloy (a nickel-molybdenum alloy containing zinc). Using three structurally disparate materials meant that a variety of wear mechanisms could be observed, representing a wide variety of industries. End mills were set up and measured as described in 3.4 End mill and workpiece preparation, 3.5 Measurement of end mill, 3.6 Measurement of slot profiles, 3.7 Criteria for end mill life, 3.8 Test procedure. The trials took place on a KERN Evo micro-milling machine with a maximum spindle speed of 50,000 RPM. The end mills used were WOTEK 0.5 mm AlTiN coated tungsten carbide end mills. Straight slots of 25 mm in length were milled to a depth of 0.2 mm. The workpiece and end mill were flooded continuously throughout the cutting process using synthetic Hocut 768. The following machining parameters were used:The different cutting speeds and feed rates used for each material can be accounted for through the use of sliding distance as the independent variable in reporting the results. The workpiece was mounted onto a 3-component force link (Kistler 9317C) (Fig. 11) capable of measuring cutting forces in three dimensions (x, y, z) aligned with the major axes of the cutting process. This was connected to a National Instruments data acquisition system (DAQ) and. Kistler software was used to analyse the recorded data. After each cut was completed, the end mills were imaged (by SEM) to measure the wear.
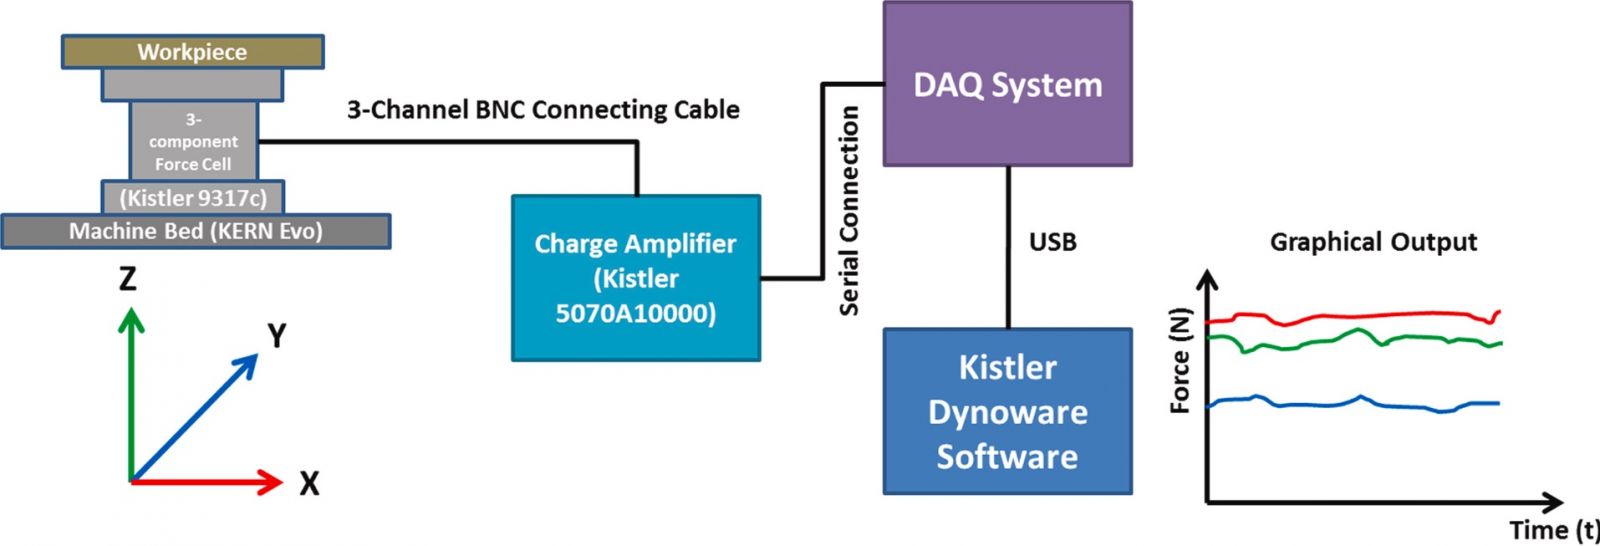
Fig. 11. Schematic of the force measurement setup.
Results of this work were then used both to investigate the wear of the end mills with a view to extending their useful life, and to confirm the testing protocol described.
4.2. Results - observed s-curves for hastelloy, titanium and brass
4.2.1. Hastelloy
Fig. 12 shows a end mill wear curve for rake face wear due to cutting of Hastelloy C-276. Unfortunately, sampling rate in terms of measuring wear is less than desirable (wear measurement took place every 21.84 m) and future studies were designed to measure the wear after a shorter sliding distance. For one of the teeth (where tooth number has no physical meaning), the following stages of wear can be seen: I. An initial rapid wear as the end mill is run-in (this is shown in the yellow portion of the graph). II. Steady state wear (green). III. Rapid wear before end mill failure (red). Occasionally, a region with apparently zero gradient is seen at the end of end mill life, where wear has exceeded the length of the cutting edge: that is to say, the end mill is no longer cutting effectively. At this point, rubbing and shaft failure occurs. The other tooth shows no apparent adherence to these stages, due to the initial state of the end mill: this tooth was already rounded. This reinforces the need to initial inspection of end mills to ensure they have met a minimum standard.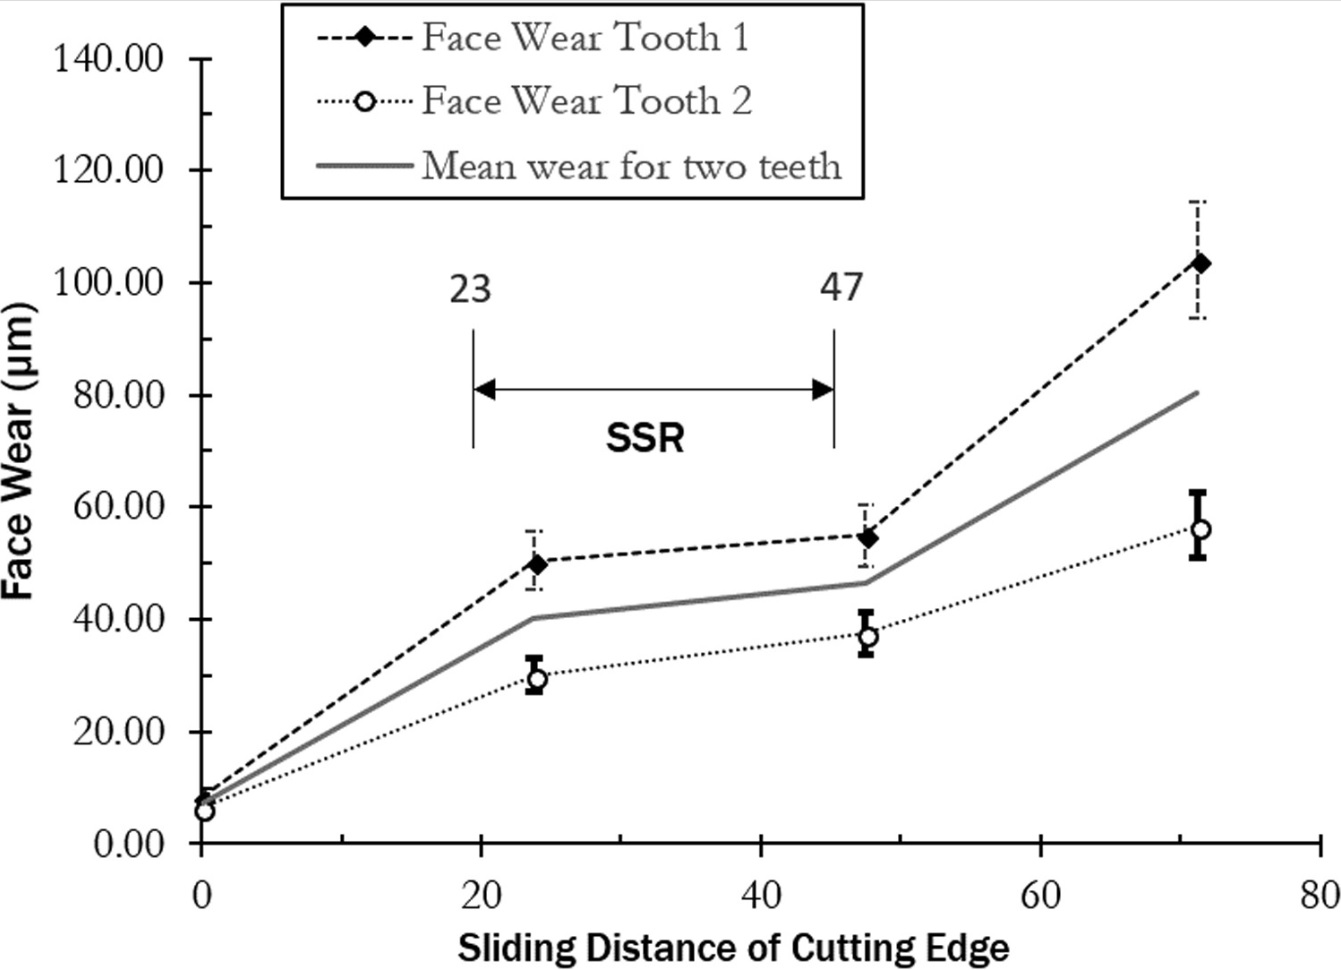
Fig. 12. End mill wear curve measured for face wear of end mill used to machine Hastelloy C-276.
The end mill wear for one tooth was higher than that for the other. To understand this, the force signature of the end mill was examined as seen in Fig. 13. It can clearly be seen that one tooth has experienced more engagement than the other, and thus the cutting forces experienced are higher. There are two possible reasons for this: the first is that the initial wear on the second tooth is greater (and indeed this was verified by looking at images of the end mill before cutting took place), and the second is that end mill run-out causes uneven engagement of teeth. It is known that the machine spindle has some run out from existing service data. This has been reported as being highly significant in micro-machining, in general, where the end mills are smaller, and this type of behavior is typically seen in micro-milling, to the extent that sometimes only one tooth is engaged.
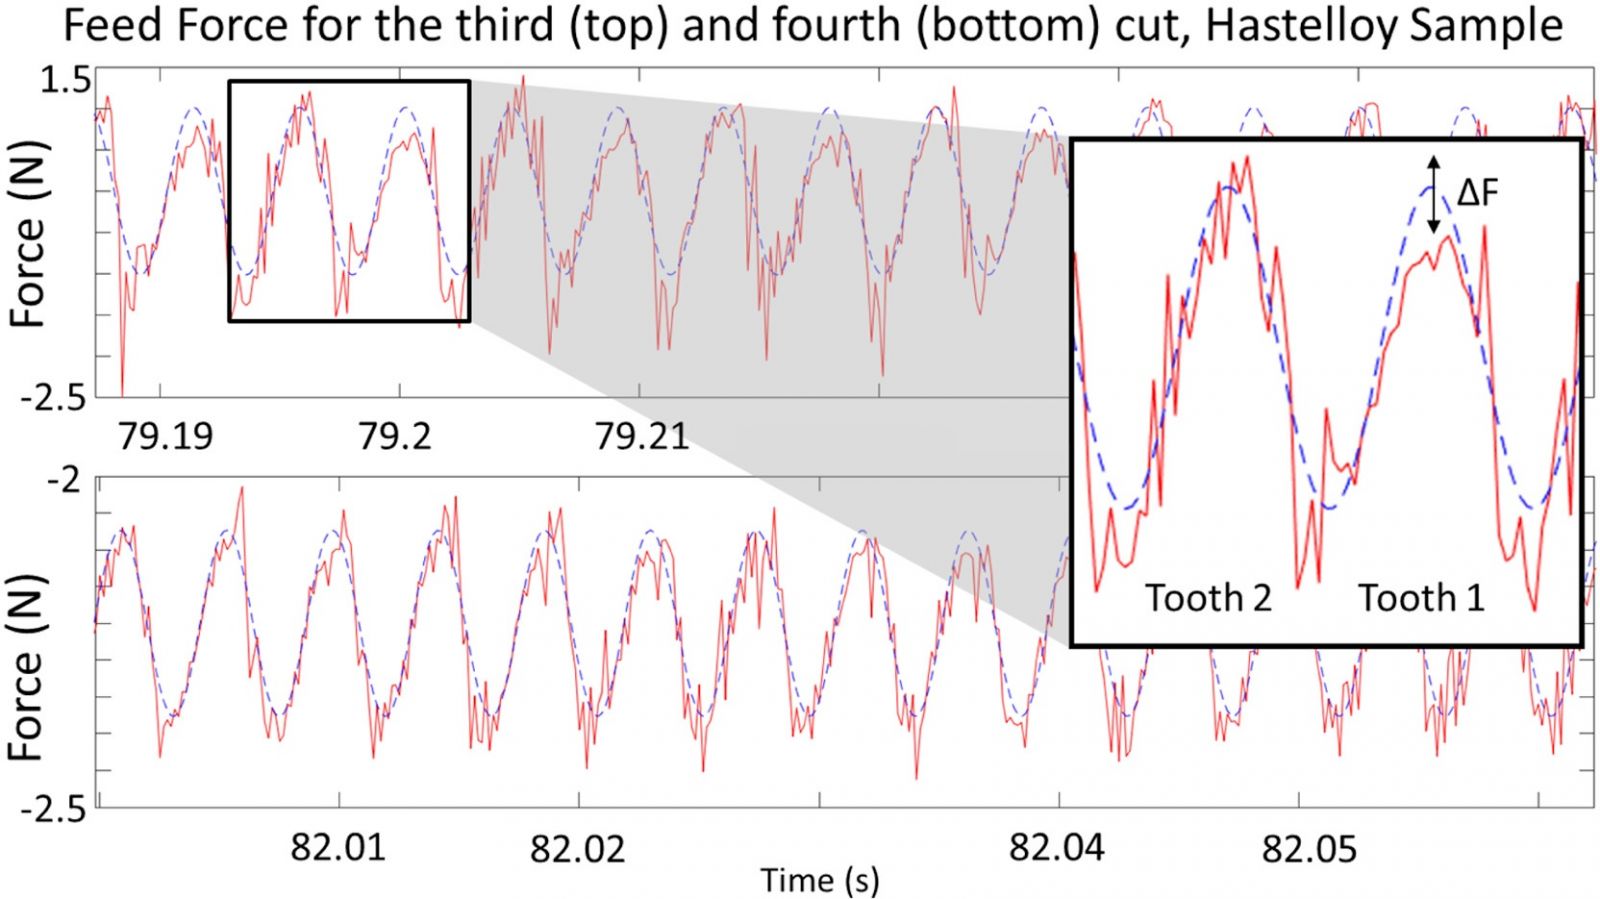
Fig. 13. The force signature for the tool used to machine Hastelloy C-276.
The outside cutting edge data (Fig. 14) showed little, if any, closeness to a traditional wear curve, resulting from the combined effects of too few measurement points for this end mill, and the inherent volatility that is seen when measuring very small end mills.
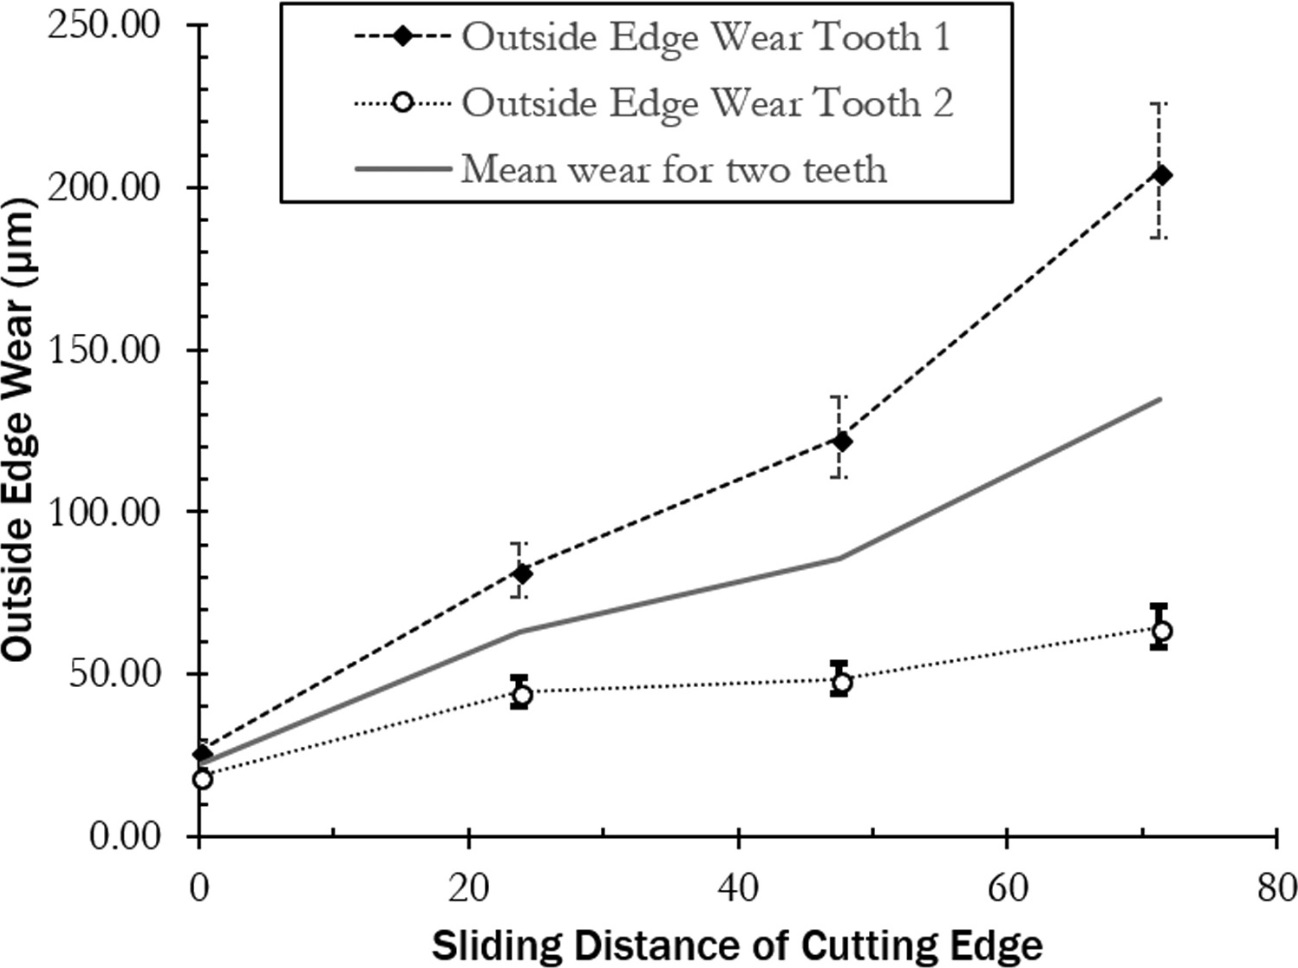
Fig. 14. End mill wear curve measured for outside edge wear of end mill used to machine Hastelloy C-276.
Flank wear (Fig. 15) reveals a much more consistent result than face or outside edge wear and appears to lag behind face wear in terms of the wear stage. Here, initial quality of the end mill is less significant since the flank face is set back from the leading edge of the end mill, and both teeth show the first two stages of the classic wear curve.
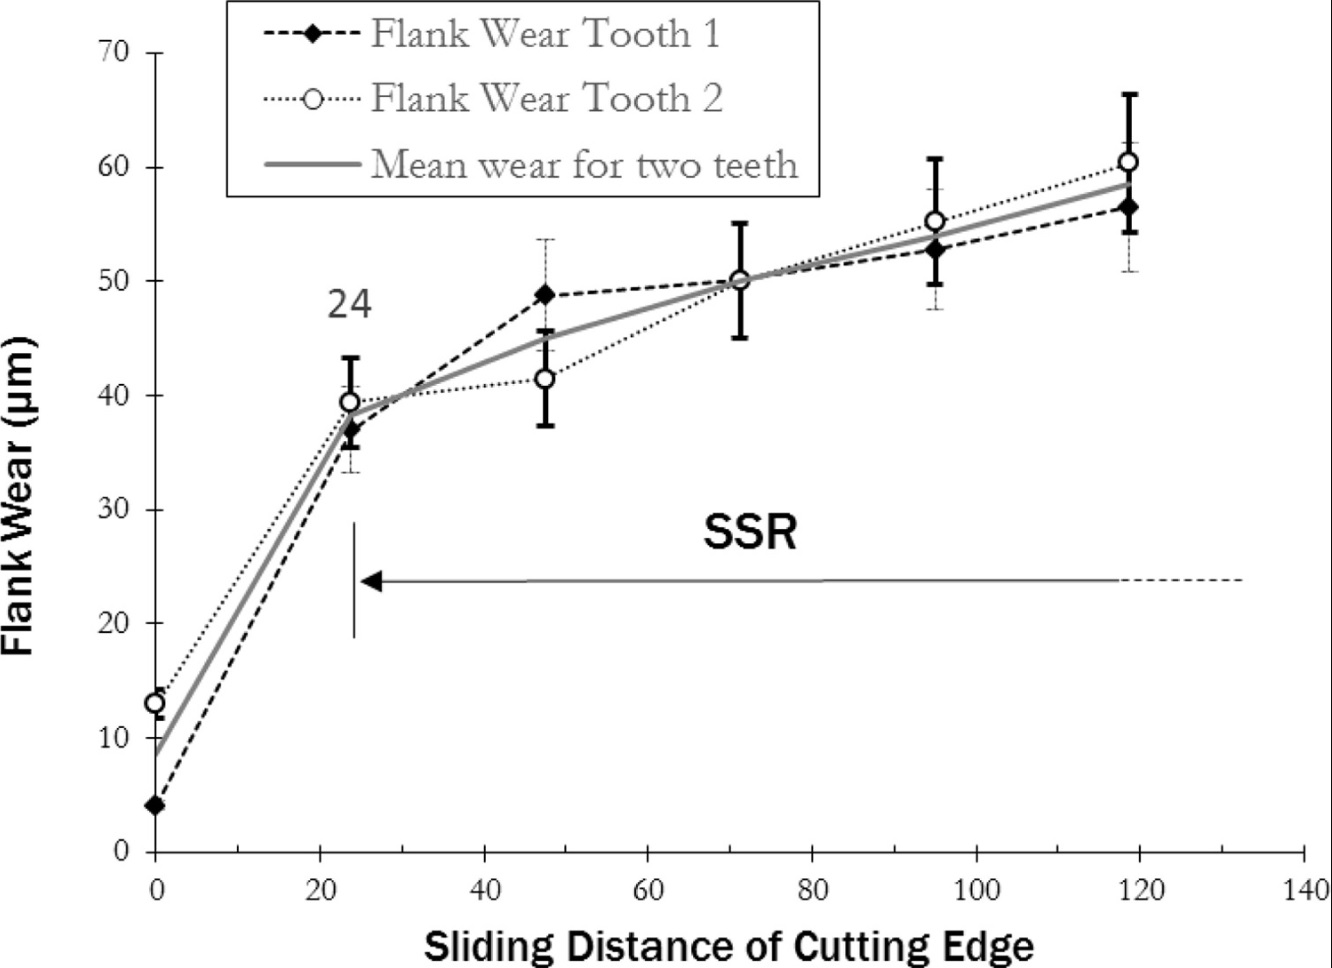
Fig. 15. End mill wear curve measured for outside edge wear of end mill used to machine Hastelloy C-276.
4.2.2. Titanium
For the end mills used to cut titanium, the rake face wear curve (Fig. 16) shows a typical s-curve up to approximately 130 µm. Wear is steady between approximately 35 µm and 90 µm, after which it accelerates rapidly - thus the end mill life criterion, defined as the point at which the end mill begins to wear rapidly, is identified to be 90 µm or 8% of the end mill radius.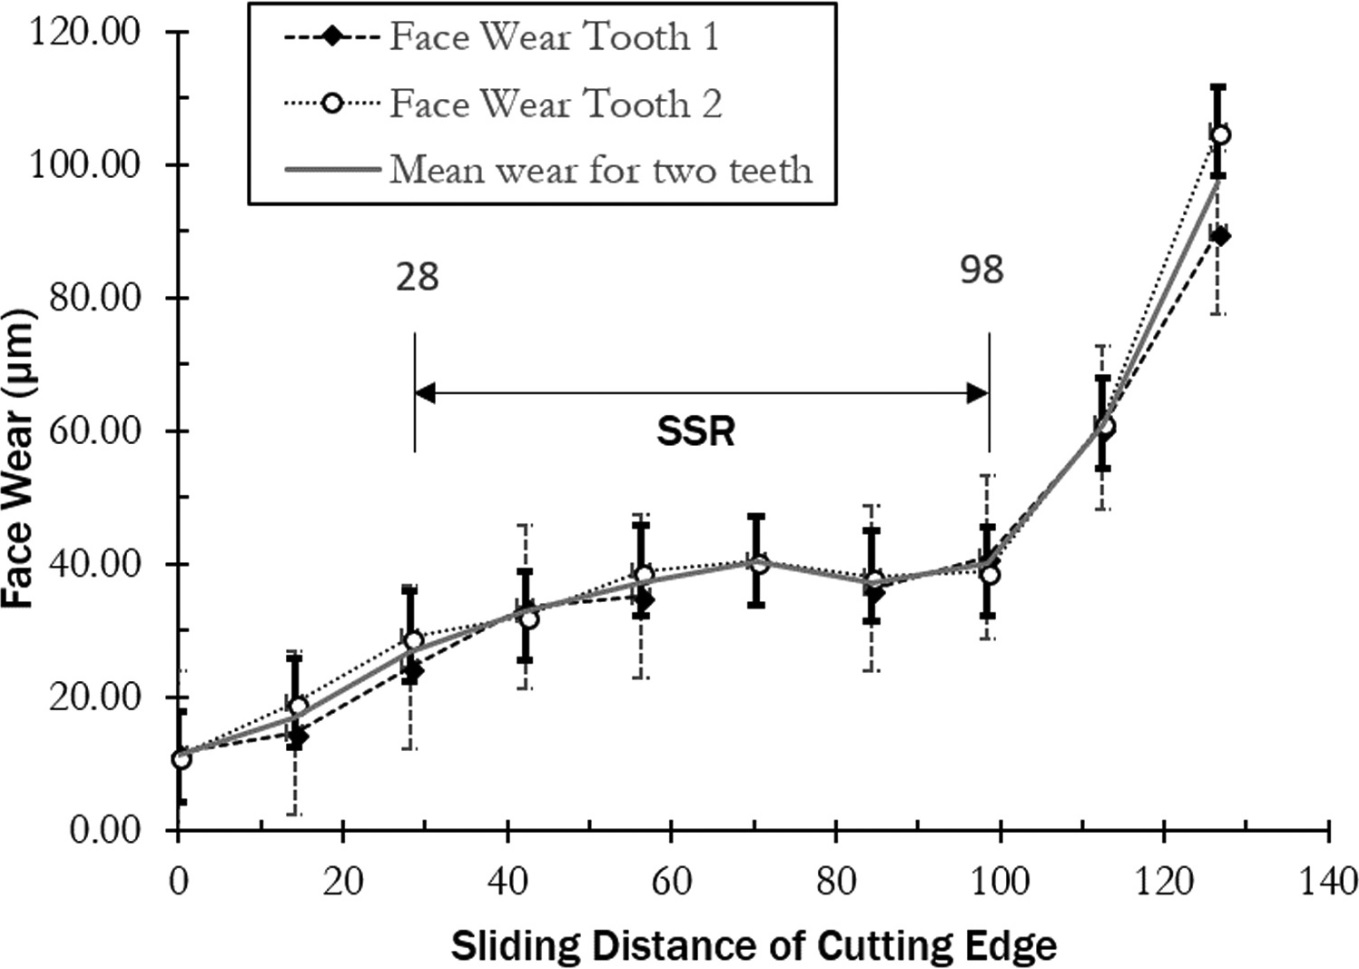
Fig. 16. End mill wear curve measured for face wear of end mill used to machine Ti grade 2.
After 100 µm of wear has occurred, the entire cutting edge has been worn off and the end mill can be considered to have failed. End mill shaft fracture may or may not occur at this point, depending on whether the centre of the end mill remains engaged with the workpiece to an extent that a cut could be attempted.
As with the Hastelloy end mills, outside edge wear (Fig. 17) does not show a clear traditional wear curve. Abrasive wear continues to take beyond the depth of cut, because of swarf from the workpiece acting as a third body. This is evacuated by the lubricant (coolant) but rubs past the end mill in this process. Wear appears to reach a steady state above a depth of 300 µm, at which point the swarf is no longer travelling up the shaft and little contact between the end mill and material takes place. Although outside edge wear is unable to provide a clear end mill wear curve, chipping on the outside edge of the end mill may affect the end mill' s ability to produce a good surface finish, or indeed the end mill' s ability to remove swarf. Thus, outside edge wear does provide some indication of impending end mill failure.
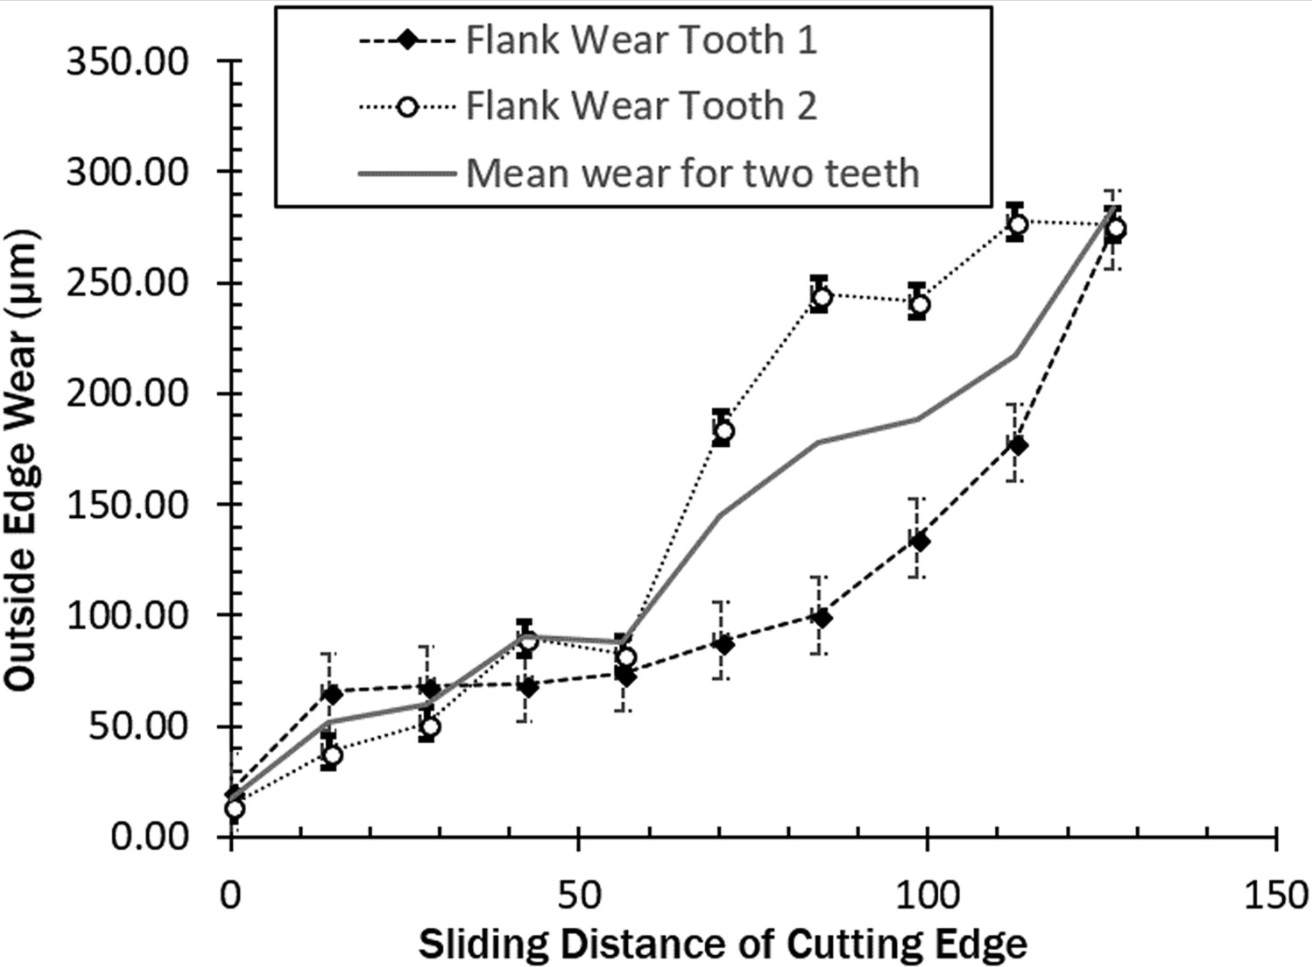
Fig. 17. End mill wear curve measured for outside edge wear of end mill used to machine Ti grade 2.
Flank wear, on the other hand, shows an S-curve as seen with face wear (Fig. 18), with the only obvious difference being the point at which each wear stage is reached.
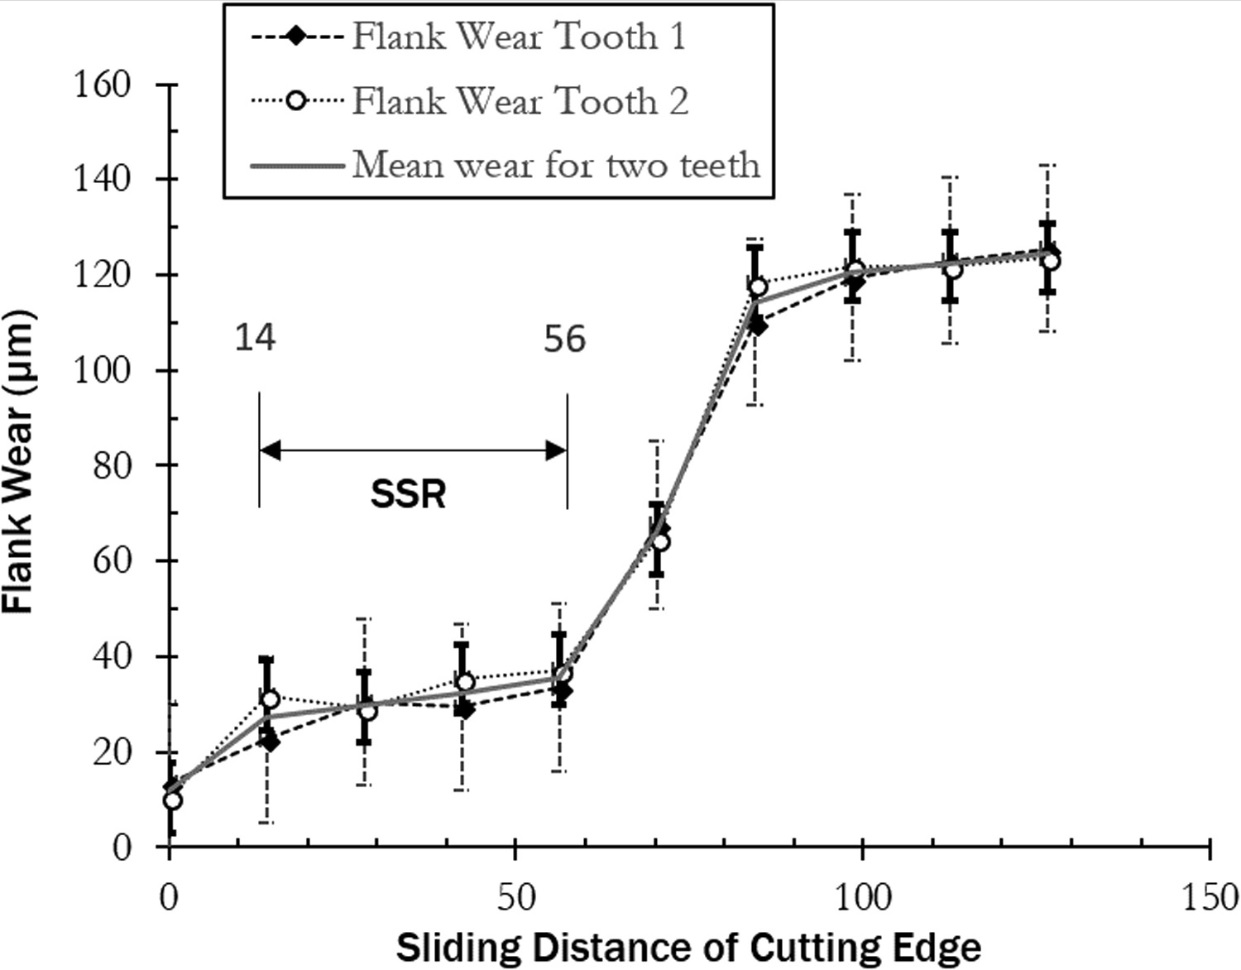
Fig. 18. End mill wear curve measured for flank wear of end mill used to machine Ti grade 2.
The shapes of the end mill wear curves achieved are strikingly similar to conventional end mill wear curves - as previously noted by Bahrudin et al. - in each case, a traditional s-curve is seen. This allows the critical wear point or end mill life criterion to be identified as the point after which end mill wear becomes intolerable. Depending on the required workpiece dimension tolerance, the actual end mill wear volume that is acceptable may be less than this.
4.2.3. Brass
Two different types of end mill were used to machine brass: those with no coating, and those with an AlTiN coating. The base end mills were TiB2. As for Titanium and Hastelloy, as shape approximating an s-curve can be seen, although machining time was so short for the uncoated end mills that data lis limited. Comparison between the TiB2 end mills used to machine brass, and the end mills which were coated with AlTiN clearly shows that the steady state portion of the graph is over twice the length for AlTiN coated end mills than TiB2 end mills. Furthermore, the steady state region for the TiB2 end mills occurred at a higher level of wear. One of the TiB2 end mills fractured before rapid wear could be seen (Fig. 19). Rake face wear is seen in the Figure, as the end mill wear curve see for coated brass end mills is taken from the preliminary study described in Section 2.3, during which only rake face wear was seen, and thus this is the only wear measurement that can be compared.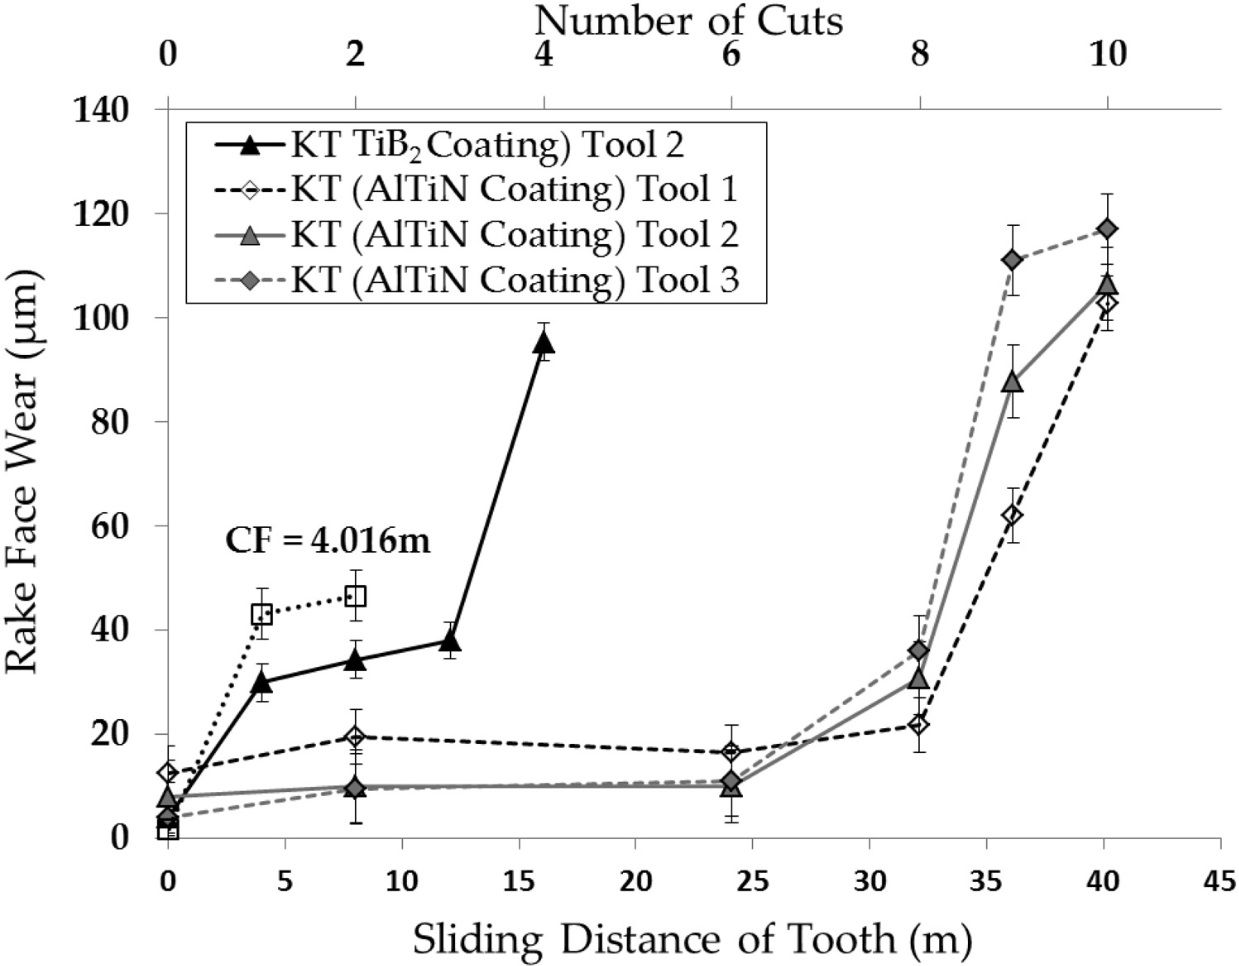
Fig. 19. Rake face wear for uncoated and coated end mills used to machine brass. CF indicates catastrophic end mill failure.
5. Reflection on protocol
Section 4.2 describes the results obtained using the protocol described in Section 3. Clear wear curves were seen using the imaging methods described for both rake face and flank wear. Other metrics, such as slot profile, which have been discussed in Section 2.2, were not able to provide as much information. This section considers each part of the protocol and its relative success, in order to determine which parts of the protocol can be concluded to be optimal when mesuring end mills.
5.1. Improvement of new method over end mill diameter
As discussed in Section 2, it is possible to describe the end mill wear in terms of diameter reduction. However, in an addition to the fact that this does not take into account features such as end mill geometry and uneven tooth wear, it can be seen from the end mill wear curves in Section 4.2 that flank wear and face wear result in different points at which extreme wear begins to take place, and even outside edge wear, while not producing a curve, can provide information about end mill chipping and imminent failure. The useful life of the end mill should be identified as the point at which either flank or face wear reaches phase III, which in the case of the titanium workpiece was the flank wear. This is not reflected in a simple diameter measurement. Although measurement of diameter may be sufficient once end mill life criterion is known, it cannot be used to determine it. The data arising from the use of the protocol described here allows the wear for each tooth to be measured for both end mill flank and face such that a much clearer understanding of how the end mills are wearing can be achieved, in a more consistent fashion, than has been previously carried out.
5.2. Efficacy of measuring slot profiles as a post-process end mill wear method
Fig. 20 shows the end mill wear observed for a titanium sample using the method described in Section 3.6. Both wear to the flank and wear to the rake face can be seen.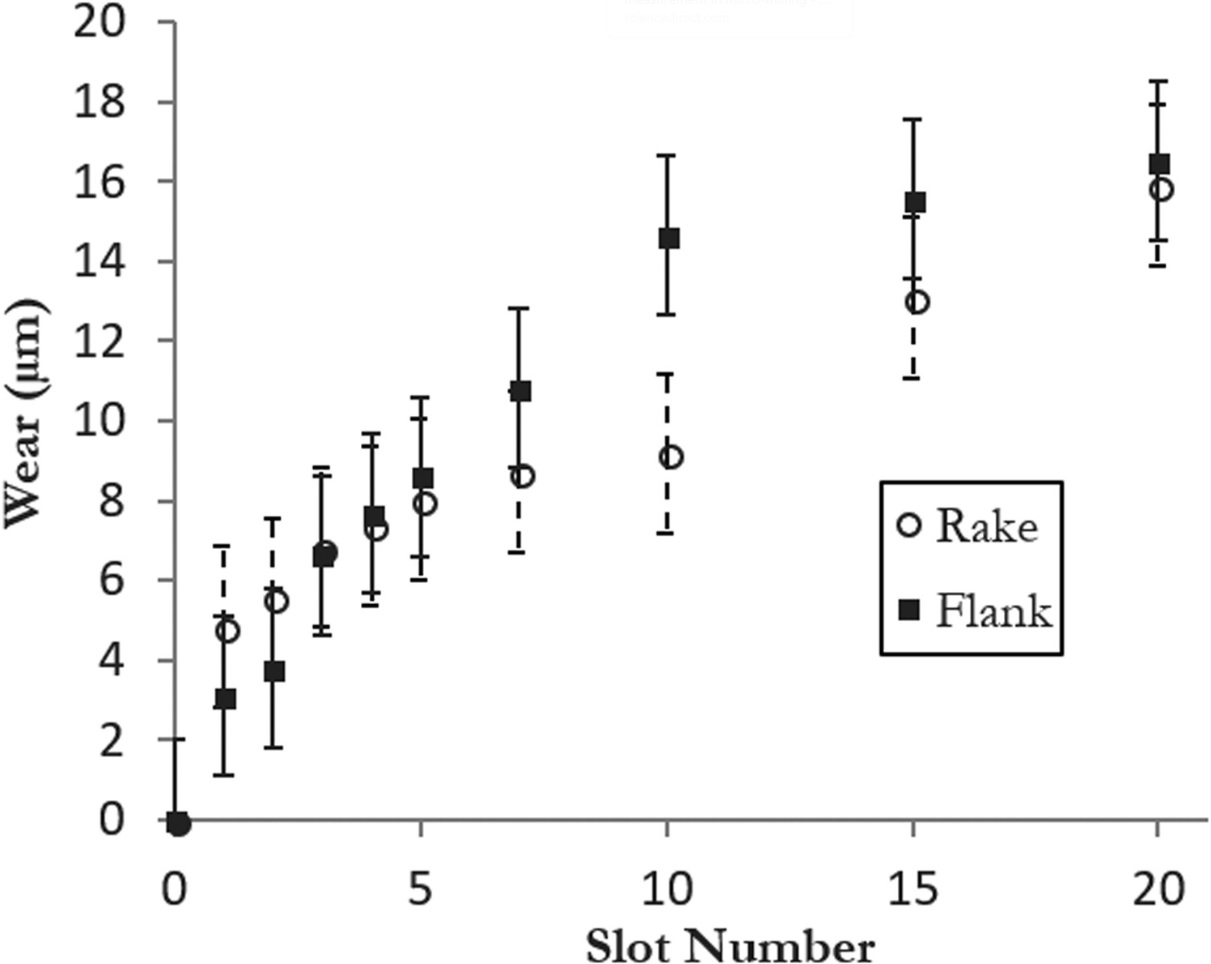
Fig. 20. End mill wear curve measured using slot dimensions for Ti grade 2.
One issue with this method was the fact that if the workpiece was removed after the initial levelling stage; its orientation in the fixture was such that its surface was not completely perpendicular with respect to the end mill. This led to an error in Wf and Wr, as can be seen in the Figure. The result of this is that absolute wear of the end mills cannot be determined using this method. However, it is still possible to identify the steady state sections of the wear, which suggests that with refinement this method could be used as a quick method of analysing end mill wear. Typically, an error in angle of workpiece would be very small.
This method cannot be used where end mills have been removed for measurement since relocation of the end mill and workpiece causes the systematic error to become large and random, and the results become unreliable.
5.3. Sliding distance Vs. Cutting distance
As described in Section 3.3, sliding distance is more appropriate for plotting end mill wear against than cutting distance or cutting time, as the amount of work carried out on the end mill depends on spindle rotational speed (RPM) and feed rate.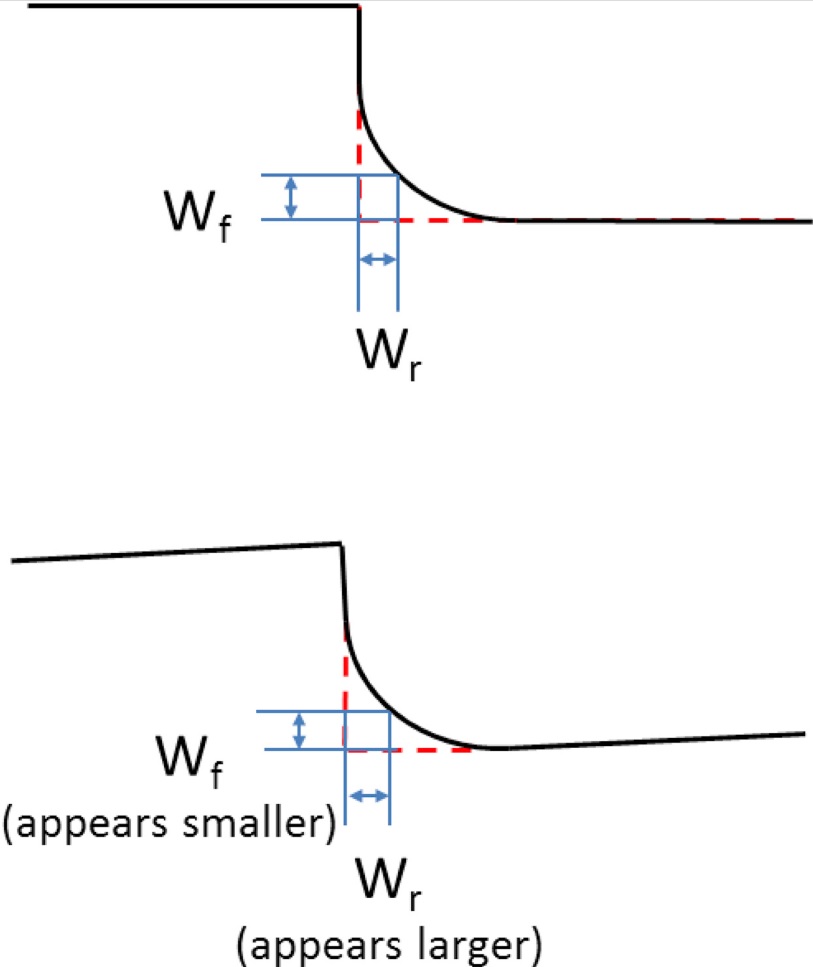
Fig. 21. Possible sources of error when measuring slots.
When the end mill wear for titanium and Hastelloy are compared as in Fig. 22 using cutting distance, the end mills used to cut Hastelloy enter the third wear stage at approximately the same cutting distance that the end mills used to cut titanium enter steady state wear. This comparison is misleading since the end mills used to cut Hastelloy use lower feed rates and speeds due to Hastelloy's comparative resistance to cutting, and thus the graph plotted using sliding distance is more representative. Using sliding distance, it can be seen that even considering the higher sliding distance per cutting length for the end mills used to cut Hastelloy, these end mills wear much faster than those used for titanium (Fig. 23).
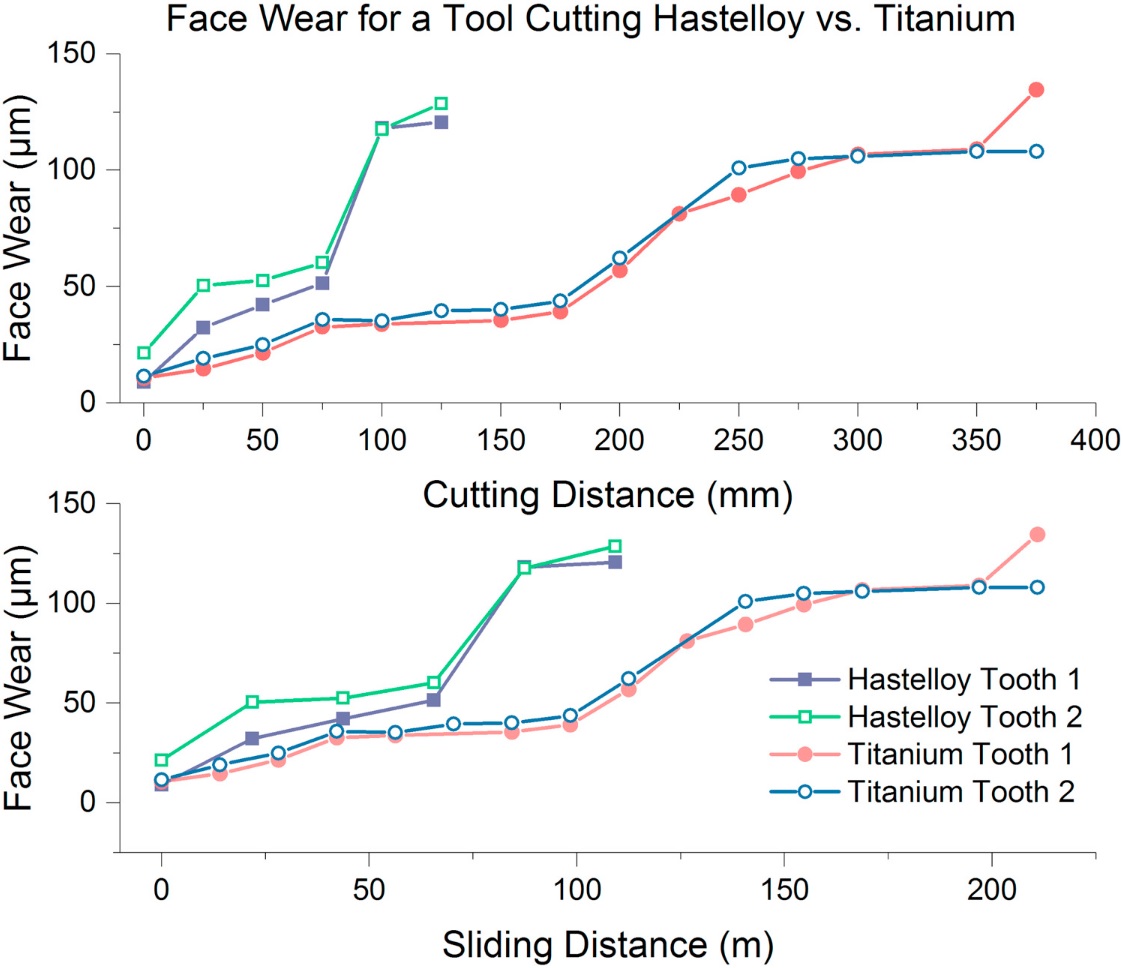
Fig. 22. Possible sources of error when measuring slots.
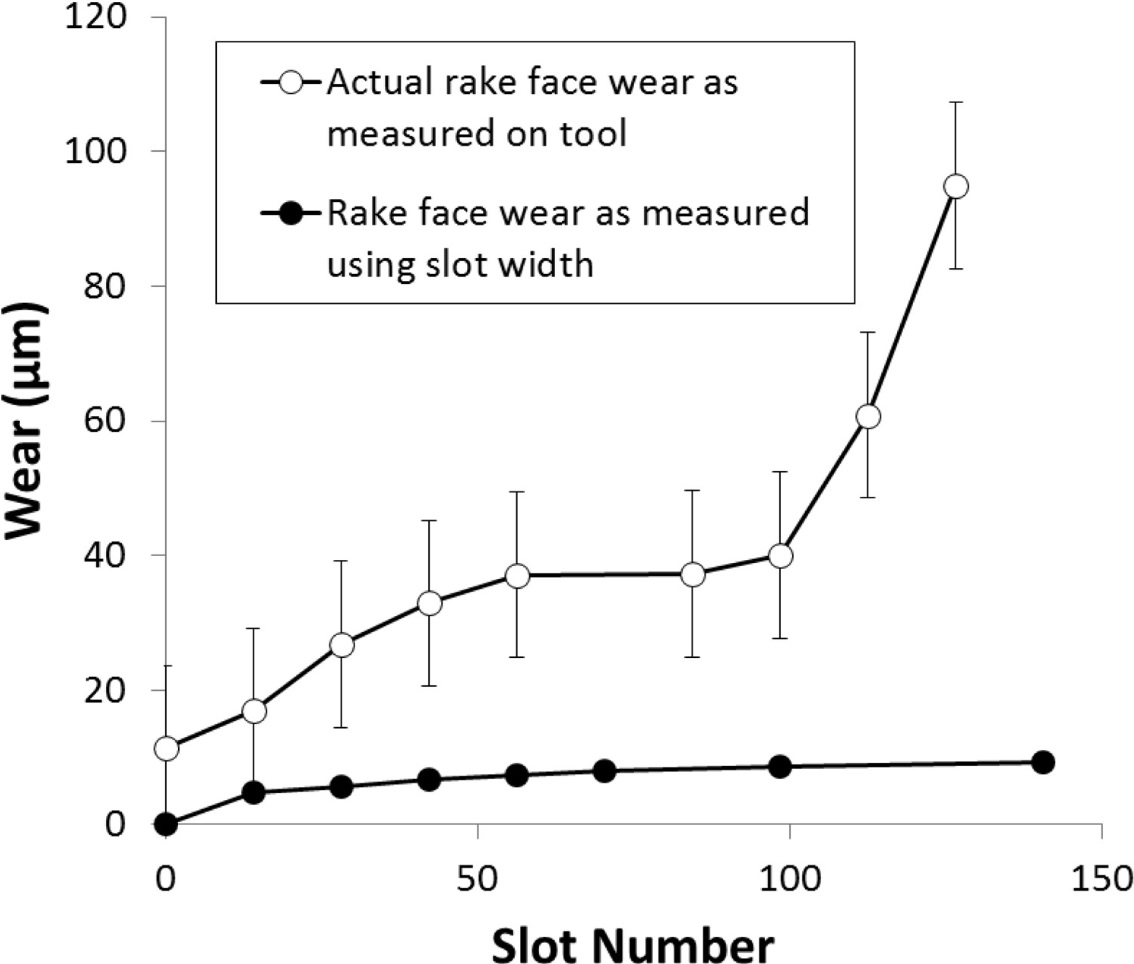
Fig. 23. Possible sources of error when measuring slots.
5.4. Direct end mill measurement Vs. Slot measurement
Figure shows the comparison between measurement of the slot profile for a end mill used to cut titanium and the actual measurement of the end mill. It can be seen that the slot measurement of rake face (measured using the method described in Section 3.6) does not accurately describe the end mill wear curve for the end mill, and therefore fails to produce the correct wear curve. This highlights the fact that although slot profile can be used as a fast method of identifying where wear has taken place, to obtain detailed information on end mill wear direct measurement is needed.
5.5. Rake face wear Vs. Cutting forces
Rake face wear is compared with the feed component of cutting forces to the relationship between the two. This comparison is seen for Hastelloy is seen in Fig. 24: Both teeth experienced similar wear for the rake face, with the transition between phase 1 and 2 (as described in Section 5) occurring at 22 m of sliding distance, and the end mill life criterion occurring at a sliding distance of 65 m.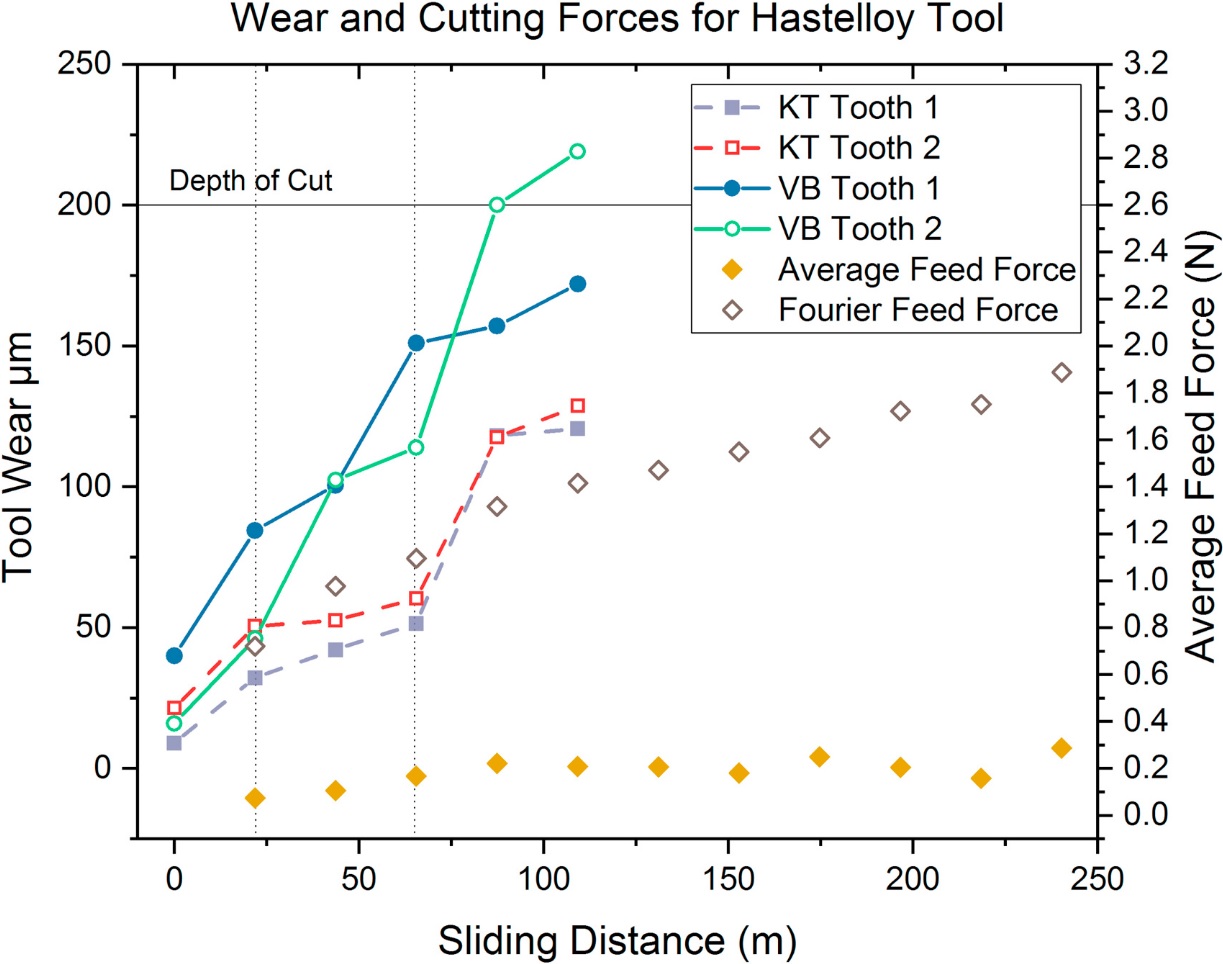
Fig. 24. Wear in relation to cutting forces for a end mill used to cut Hastelloy C-276.
It can be seen for both sets of force data that both the average feed force and the range of feed forces (end mill vibrations) initially increase with end mill wear but that the rate of this increase plateaus with end mill wear - this is consistent with the hypothesis that the end mill is sufficiently worn that there is little engagement between end mill and workpiece.
Compared with the data for Hastelloy, the end mill used to cut the first titanium sample has significantly more data points. A clear S-curve is initially seen for face wear (Fig. 25), with steady state wear occurring at a sliding distance of 42 m and the end mill life criterion occurring at a sliding distance of 99 m. The curve then flattens out with reduced engagement and a dramatic wear increase is seen when tooth 1 fractures. Average feed force increases consistently, and interestingly continues to do so linearly with sliding distance even when the gradient of end mill wear is at its lowest (i.e. in stage 2). The average feed force plateaus only when end mill wear plateaus at the end of cutting due to lack of engagement. The Fourier transform of the force also starts by increasing linearly, but plateaus after the steady state region, likely because of reduced end mill-workpiece contact.
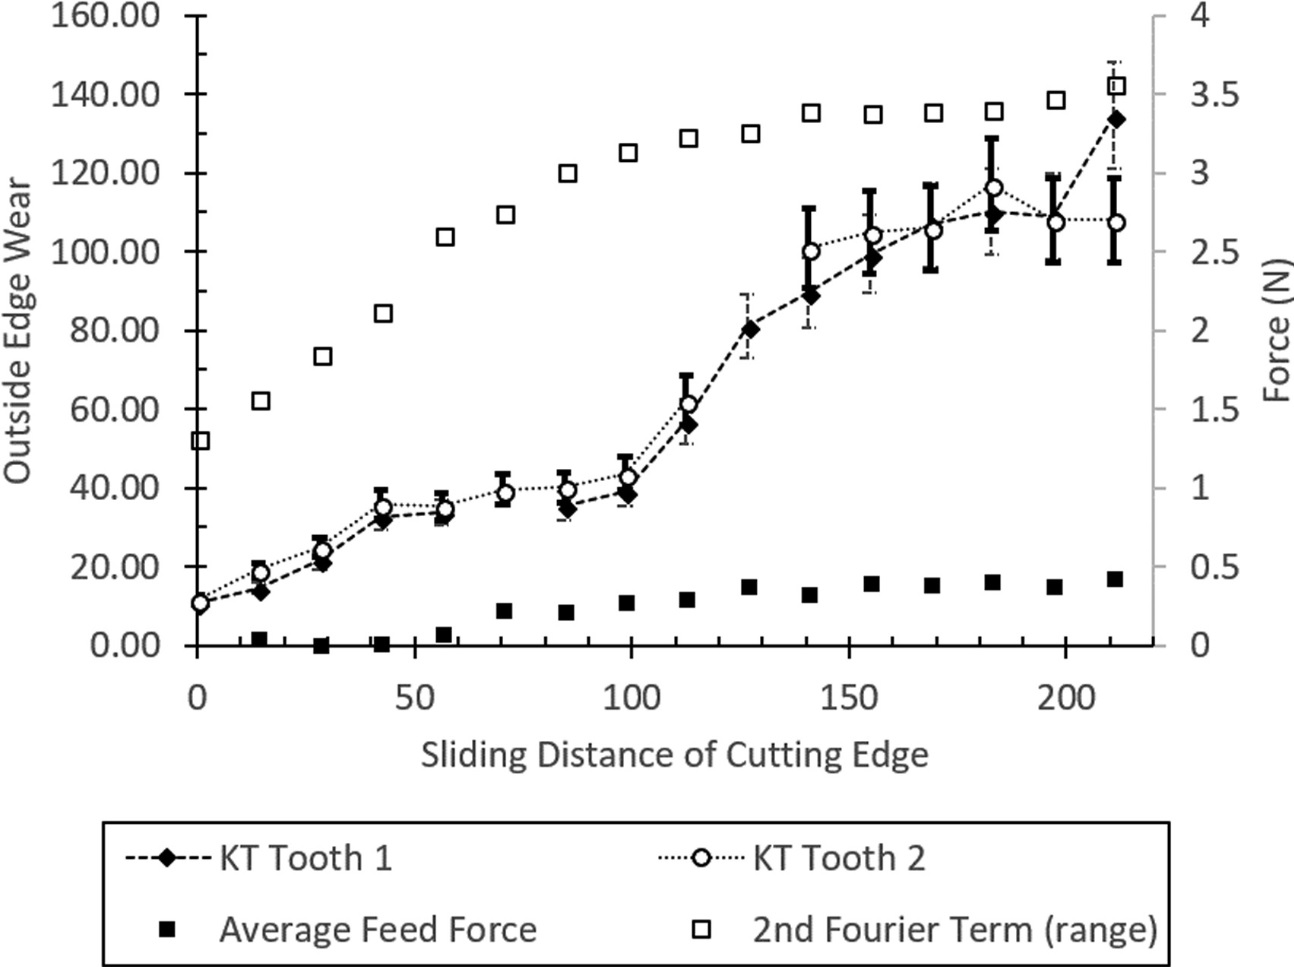
Fig. 25. Wear in relation to cutting forces for a end mill used to cut Ti grade 2.
As well as initial edge rounding having much more significance for smaller end mills, the coating thickness can be much more significant: both because it comprises more of the diameter of the end mill (a thickness of 2 µm represents 0.4% of the end mill diameter as compared with 0.04% for a 5 mm end mill) and because it increases the initial edge radius. The issues with consistency in results discussed here indicate again the importance of ensuring that the end mills are closely inspected before cutting takes place in future studies and reinforce the need for a standard protocol for micro end mill wear measurement.
5.6. Force signature - looking at uneven engagement of teeth
The force signature was investigated for each of the cuts made. Varying degrees of difference in force signal between teeth with seen, with an example for one of the Hastelloy cuts given in Fig. 26.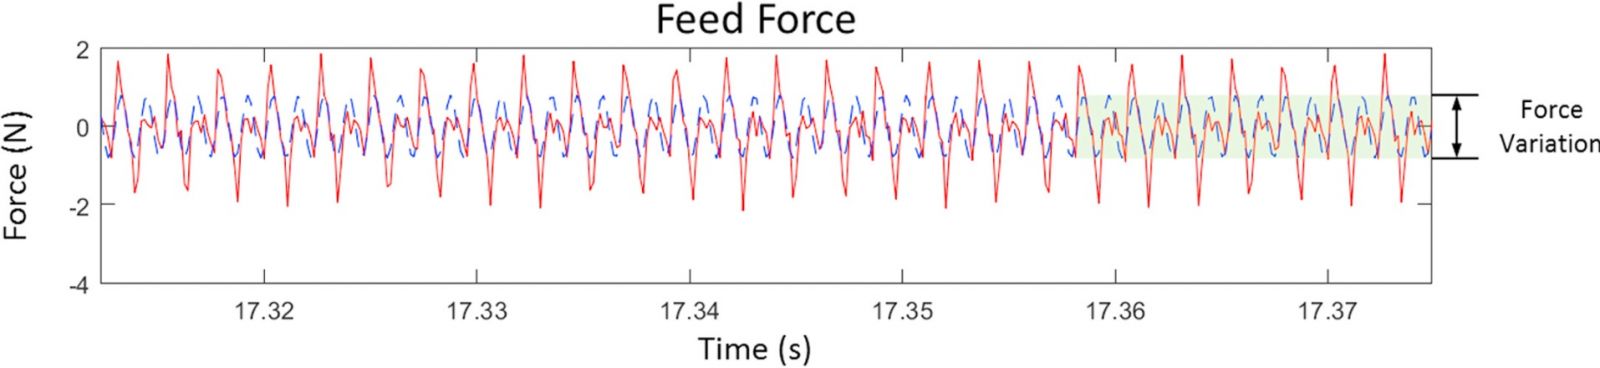
Fig. 26. The fit made using the second term of the Fourier series.
The unanalysed force signature for the end mills indicates that tooth wear engagement is often much more uneven than that seen for macro-milling end mills. This has been seen before: Mativenga and Hon reported an engagement difference of no more than 30%. However, this amounted to a force difference of approximately 20 N. Similarly, Kim and Jeon observed a force difference of approximately 10 N over a 50 N range (<20% difference) for 8, 12 and 14 mm end mills cutting Al6061-T6 aluminium alloy but the magnitude of the forces is much lower in micro machining. Furthermore, end mill run-out has much more significance for a smaller end mill, as demonstrated by Fig. 27. As previously discussed, uneven engagement of teeth caused by runout causes different levels of wear to each tooth than that experienced by micro-milling. This results in a force signature that can be dramatically different for both teeth. Where the wear curve for each tooth is very similar, it should be expected that the force signature for each tooth is also similar.
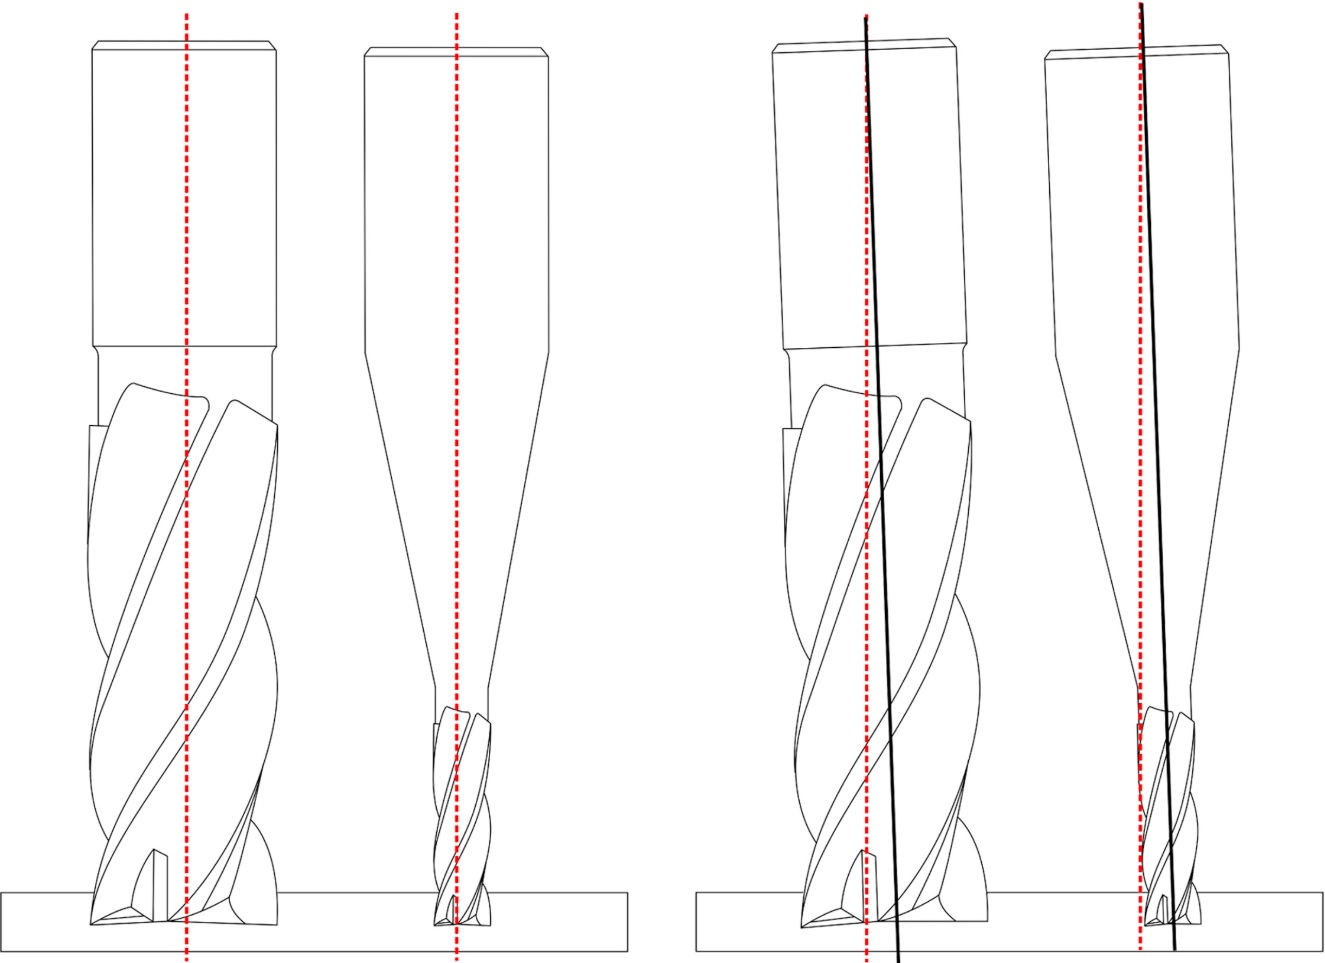
Fig. 27. Effect of runout is magnified for a smaller end mills.
5.7. Mechanism of end mill breakage
One major consideration in micro-milling is the relative size of the workpiece grains in relation to the end mills. Fig. 28 shows (to approximate scale) the size of the grains for Hastelloy. Many of the grains are in the order of 10 m, which is 2% of the end mill's diameter. The structure appears inhomogeneous to the end mill and thus the cutting forces can vary significantly from pass to pass. This causes sudden fracture to the teeth from time to time, rather than the smooth, even wear that would be expected in macro milling. To further understand the mechanism of end mill breakage, it is useful to look at the chips produced during the end mill wear process (Fig. 29).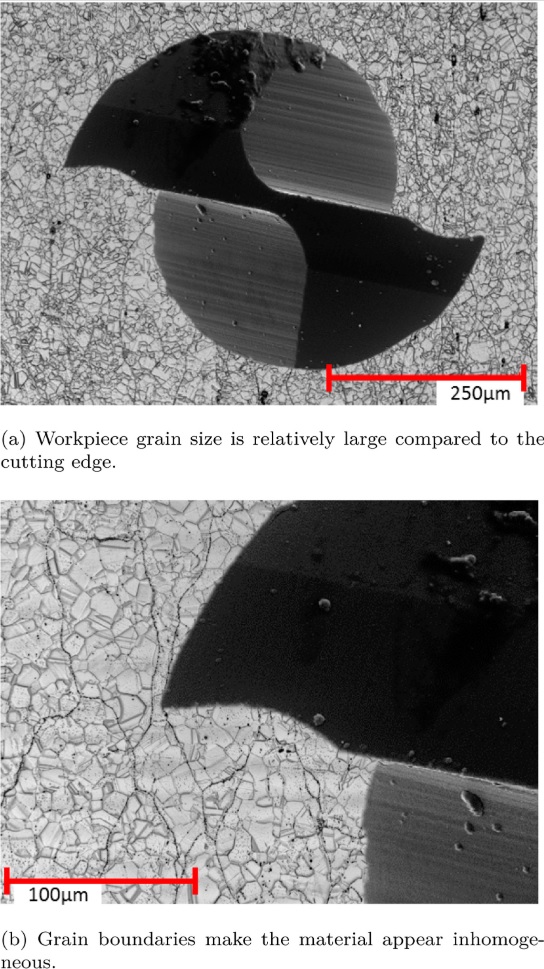
Fig. 28. Grain sizes relative to end mill size.
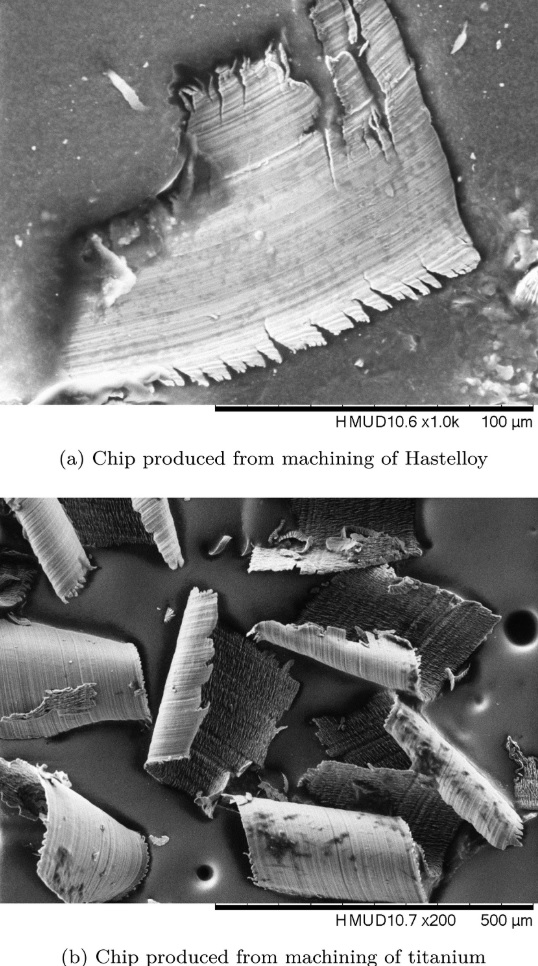
Fig. 29. Chips produced in machining.
Due to the very small size of the chips (typically the chips are no more than 200 µm in length and width) it is very difficult to collect and study them. However, some examples of chips for each material were collected directly from the work pieces. For both the titanium and the Hastelloy, serrated type chips were seen, of the type shown in Fig. 22. Examples of both chips are given in Fig. 21. The chip formation is an indicator of regions of intense shear followed by regions which are relatively undeformed. This results from high machining temperatures which are not dissipated quickly, as is common when cutting titanium and nickel alloys. This can cause cutting edge attrition due to irregular flow of material as well as thermal fatiguing which results in chipping and cracking. The result of this can be the eventual catastrophic failure of the end mills (Fig. 30).
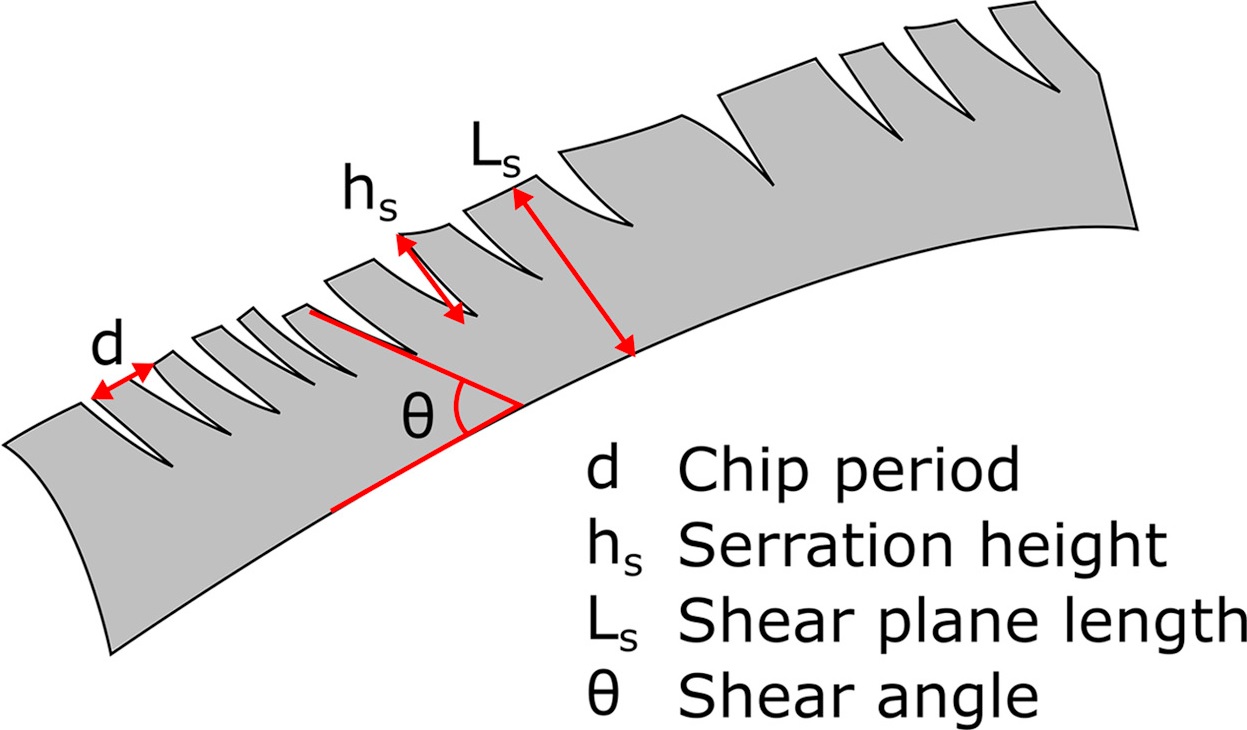
Fig. 30. A serrated-type or discontinuous chip.
5.8. Considering alternative coatings: an early investigation into extending end mill life through coatings
Coating end mills used to machine brass with AlTiN (Fig. 19) in Fig. 6 showed a dramatic lengthening of the steady state region of the end mill wear curve for AlTiN coated end mills. Additionally, the steady state occurred at a lower wear level for these end mills. The latter result has previously been reported but the lengthening of the curve is significant as it indicates a longer end mill life. The early fracture of one of the TiB2 end mills is likely to have been caused by imperfections in the carbide material or excessive cutting forces generated by burring or larger crystals in the brass and serves as a reminder of the difficulty of measuring end mills on the micro-scale and the importance of pre-inspection. This result suggests that even for softer metals such as brass, coating end mills can significantly improve end mill life. To a certain extent, this relates to cutting edge radius - the applied coating increases the cutting edge radius of the end mills, and this cutting edge radius reduces stresses on the end mills. This extension of end mill life is worth investigating further.
6. Conclusions
Considering the difficulties encountered when comparing studies on end mill wear in micro-end-milling, a protocol for measuring, characterising and reporting wear on sub-millimetre end mills is proposed. The purpose is to provide a method such that studies between different end mill geometries and materials can reasonably be compared. Standardisation will make building on existing studies possible, while the characterisation of wear curves for different end mills has direct applications in manufacturing for maximising process efficiency.
The results obtained in the validation wear tests have indicated that the wear measurement protocol proposed allows the wear curve of sub-millimetre micro end mills to be plotted, with the following points of note:
I. Using the suggested protocol, stages of wear can be identified as with macro end mills, such that the wear of the end mill is not allowed to go beyond the steady state region.
II. Outside edge wear provides little information when studying the wear of micro end mills, due to the significant wear effects of chips sliding past these edges during machining. A combination of face wear and flank wear provides much more consistent data.
III. By examining the end mills using SEM techniques including backscattered electrons, and examining the chips, it is possible to understand the wear mechanisms taking place, which is useful when designing coatings for micro end mills.
IV. It is common for the teeth of the end mills to wear unevenly due to spindle run-out, which can lead to single tooth failure even relatively early in the end mill wear curve. This highlights once again the importance of minimising this as compared with macro milling.
V. Sliding distance presents a much more appropriate measure of reporting micro end mill wear than cutting distance or cutting time, since it considers cutting speeds and feed rates.
VI. Although there is scope for analysing channels and features in the workpiece as a method of end mill wear measurement, which would dramatically speed up measurement time due to a single measurement rather than multiple removal of end mills, this method is only able to provide information about the end mills after the event and requires very strict machining to be of use. It is thus less robust for plotting wear curves than direct measurement of end mills.
Based on literature reviewed in Section 2, there is scope for significant further investigation of coatings for larger micro-end-mills, since many end milling companies offer standard coated and uncoated micro-end-mills, but the research into coatings for micro end mills is significantly less extensive than that for larger end mills. Despite the disadvantages that coatings have (for example, increased cutting edge radius) there is opportunity for significantly extending end mill life here.
As the end mills tested were 500 μ m diameter, further work should investigate the size limits of this protocol and establishing new methods where this protocol is no longer appropriate.
Acknowledgements
The authors wish to acknowledge the contribution of D.T. Curtis of the University of Sheffield Advanced Manufacturing Research Centre to discussions regarding end mill wear prior to the conception of this work; and the financial support of the Engineering and Physical Sciences Research Council, UK EPSRC (EP/L016257/1) in this work.